

How to forecast a company’s revenue before financial statements are published
Companies’ annual financial statements are typically published several months after the end of the financial year. However, when assessing competitors, potential customers, or business partners, it is important to understand how their performance is changing without having to wait for the latest financial results.
One potential early indicator of revenue trends is the dynamics of taxes paid by a company to the State Tax Inspectorate (VMI).
Changes in taxes paid can help forecast a company’s revenue trends and estimate its potential growth rate. However, it is important to consider that taxes paid to the VMI include not only value-added tax, but also personal income tax, corporate income tax, and other taxes, whose changes are not always directly linked to sales.
Main taxes paid by companies to the State Tax Inspectorate (VMI)
Depending on the nature of their business activities, companies pay different types of taxes to the State Tax Inspectorate. The following are particularly relevant when analyzing company performance:
-
Value-added tax (VAT) – related to the sale of goods and services, although the amount payable also depends on deductible input VAT, applicable tax rates, and other factors.
-
Personal income tax (PIT) – tax withheld by companies from employees’ salaries, bonuses, and other taxable payments and remitted to the VMI.
-
Corporate income tax (CIT) – tax paid by companies on taxable profits, which do not necessarily change at the same rate as revenue.
Some companies also pay excise duties and other taxes applicable to their business activities. As a result, the total amount of taxes paid to the VMI may consist of different components depending on the company’s industry.
Since different factors influence the amounts payable for each type of tax, changes in total tax payments should be assessed in the context of the company’s specific business activities. Nevertheless, this indicator can provide useful insights into potential changes in a company’s sales revenue.
How to estimate potential revenue growth based on taxes paid?
To make a preliminary assessment of how a company’s revenue might change during the current year, its year-to-date tax payments can be compared with those made during the same period of the previous year.
For example, suppose a company paid €100K in taxes to the VMI between January and September of the previous year, compared with €110K during the same period this year. This represents a 10% increase in taxes paid. If the company’s business model and tax structure have not changed significantly, such an increase may indicate that sales revenue is also growing.
For a simple preliminary estimate, the percentage change in taxes paid can be applied to the latest available annual revenue figure:
Estimated current-year revenue = Previous year’s revenue × (1 + Percentage change in taxes paid)
For example, if the company’s revenue in the previous year was €1M and its year-to-date tax payments are 10% higher than during the same period last year, this assumption would suggest an estimated revenue of approximately €1.1M.
This is not a precise financial forecast, but rather an initial estimate that should be refined by considering the company’s business characteristics, historical performance, and other available indicators.
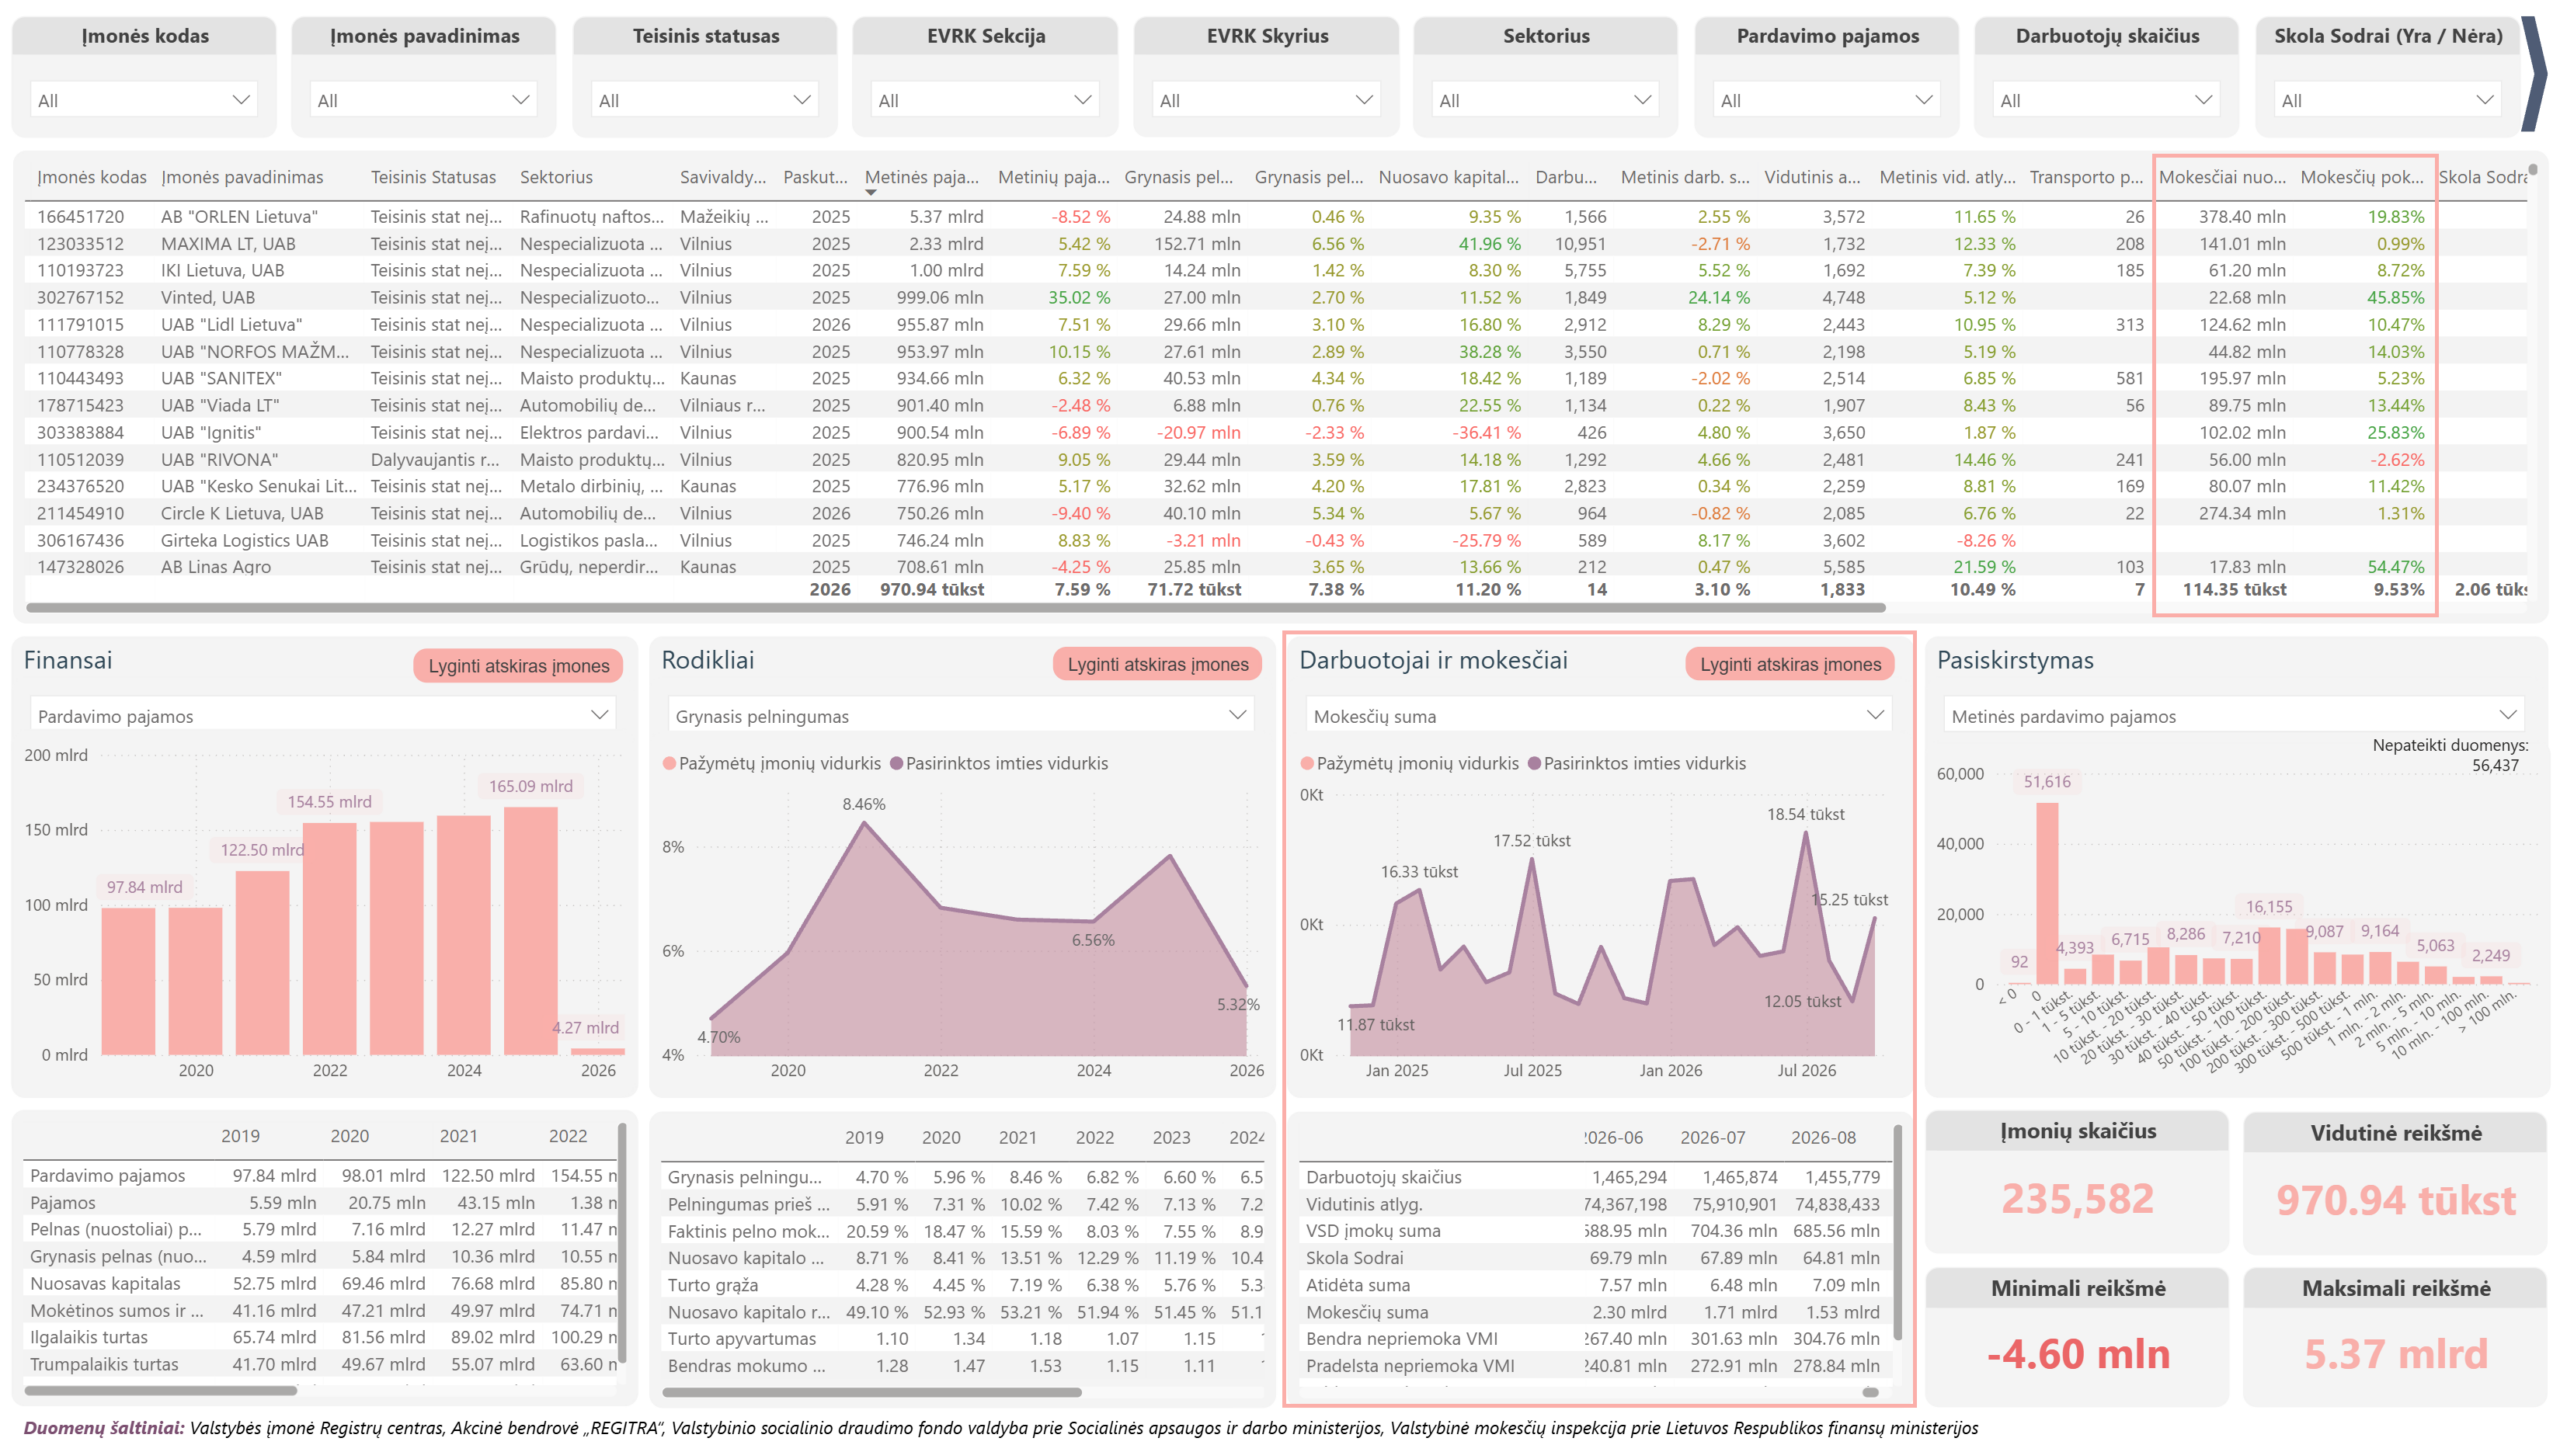
In PLY Insights’ Lithuanian company analytics, all the data needed to estimate revenue is available in one place – the main company table. For each company, the table displays the latest available annual revenue, cumulative taxes paid to the VMI since the beginning of the current year, and the percentage change compared with the same period of the previous year. This makes it possible to quickly assess potential revenue growth or decline without waiting for the latest financial statements.
For example, if the latest available data covers September 2026, the table shows the total taxes paid to the VMI from January through September 2026 and the percentage change compared with January–September 2025. This percentage change can then be applied to the latest available annual revenue figure to calculate a preliminary revenue forecast for 2026.
To refine the forecast, PLY Insights allows users to analyze changes in a company’s tax payments and workforce indicators in greater detail. The Employees and Taxes section provides monthly data on taxes paid to the VMI, employee headcount, and average salaries. These figures help determine whether changes in tax payments follow a consistent trend or whether the overall growth rate may have been influenced by one-off payments that did not occur in previous years. In addition, increases in employee headcount or salaries may explain part of the rise in total taxes paid due to higher personal income tax payments.
Comparison of revenue and tax payment changes among Lithuanian companies
Can changes in taxes paid really provide an indication of a company’s revenue trends? To explore this, we compared changes in sales revenue and taxes paid to the State Tax Inspectorate (VMI) in 2025 versus 2024 for 10 of Lithuania’s largest companies from different sectors.
|
Company |
Sector | 2025 Revenue | 2025 Revenue Change, % | 2025 Tax Payment Change, % |
Difference, pp |
| AB “ORLEN Lietuva” | Manufacture of refined petroleum products and fossil fuel products |
€5.37bn |
-8,52% | -20,53% |
12,01 |
| MAXIMA LT, UAB | Non-specialized retail sale, predominantly of food, beverages and tobacco |
€2.33bn |
5,42% | 3,20% |
2,22 |
| UAB “SANITEX” | Non-specialized wholesale of food, beverages and tobacco |
€934.66m |
6,32% | 6,56% |
0,24 |
| UAB “Ignitis” | Sale of electricity |
€900.54m |
-6,89% | -12,39% |
5,50 |
| UAB “Kesko Senukai Lithuania” |
Retail sale of hardware, building materials, paints and glass |
€776.96m | 5,17% | 2,54% |
2,63 |
| AB “Lifosa” |
Manufacture of fertilizers and nitrogen compounds |
€605.71m | 169,87% | 166,71% |
3,16 |
| Telia Lietuva, AB | Wired, wireless and satellite telecommunications activities |
€507.28m |
3,29% | 13,88% |
10,59 |
| UAB “NEO GROUP” | Manufacture of plastics in primary forms |
€462.97m |
-10,76% | -18,34% |
7,58 |
| UAB “AVAD Baltic” | Wholesale of information and communication technology (ICT) equipment |
€445.08m |
1,22% | -2,02% |
3,24 |
| UAB EUROVAISTINĖ | Retail sale of pharmaceutical products |
€399.08m |
9,24% | 12,10% |
2,86 |
Data sources: State Enterprise Centre of Registers and the State Tax Inspectorate under the Ministry of Finance of the Republic of Lithuania.
Comparing changes in revenue and taxes paid to the VMI across these 10 Lithuanian companies in 2025 reveals several patterns. For 9 out of the 10 companies analyzed, revenue and taxes paid to the VMI moved in the same direction. Seven companies recorded revenue growth, and six of them also paid more taxes than in 2024. The only exception was AVAD Baltic, whose revenue increased slightly (1.22%), while its tax payments to the VMI decreased by 2.02%. Meanwhile, all three companies that experienced a decline in revenue – ORLEN Lietuva, Ignitis and NEO GROUP – also recorded a decrease in taxes paid.
For 5 out of the 10 companies analyzed, revenue and taxes paid to the VMI moved in the same direction, with a difference of no more than 5 percentage points between their respective changes. This suggests that, for these companies, changes in tax payments reflected not only the direction of revenue growth or decline but also its approximate magnitude. The closest match was observed for SANITEX, whose revenue increased by 6.32%, while taxes paid to the VMI rose by 6.56% – a difference of just 0.24 percentage points. For MAXIMA LT, Kesko Senukai Lithuania and EUROVAISTINĖ, the differences between the two indicators were also below 3 percentage points.
For some companies, revenue and tax payments moved in the same direction, but the magnitude of their changes differed considerably. The largest gap was recorded for ORLEN Lietuva: in 2025, the company’s revenue declined by 8.52%, while taxes paid to the VMI fell by as much as 20.53%. A substantial difference was also observed for Telia Lietuva, whose revenue grew by 3.29%, while its tax payments increased at a much faster rate of 13.88%.
Changes in taxes paid to the VMI can serve as a useful indicator when assessing a company’s revenue trends and estimating the potential rate of growth or decline. Although this comparison is based on full-year data, a similar approach can be used to forecast revenue during the year by analysing cumulative tax payments since the beginning of the year. However, the accuracy of such forecasts depends on the nature of the company’s business activities, its tax structure and other factors.
Why don’t changes in taxes paid always match changes in revenue?
The total amount of taxes paid by companies to the VMI includes more than just VAT associated with sales. Several other factors can also influence the total.
-
VAT and purchasing structure. The amount of VAT payable depends not only on sales but also on deductible input VAT. Even when revenue is growing, increased purchases or investments may reduce the amount of VAT payable.
-
Personal income tax. Changes in employee headcount or salaries can affect the amount of personal income tax paid, even if the company’s revenue remains relatively stable.
-
Corporate income tax. The amount payable depends on a company’s taxable profit, which may change at a very different rate from revenue. For example, even a modest increase in sales revenue may lead to a much larger increase in profits and corporate income tax if profitability improves. Corporate income tax may also be affected by tax losses carried forward from previous loss-making years, which can be used to reduce taxable profits. As a result, corporate income tax paid to the VMI does not necessarily reflect changes in current-year revenue.
-
Excise duties. In sectors involving fuel, alcohol, tobacco and other excisable products, the amount of taxes paid depends not only on sales volumes but also on applicable excise duty rates. For example, an increase in excise duty rates may cause a company to pay more taxes even if the quantity of products sold or its revenue remains unchanged. The types and quantities of products sold also affect tax payments, meaning that changes in excise duties do not always reflect a company’s revenue trends.
-
International operations. Exports, sales in foreign markets and differences in VAT treatment may mean that changes in taxes paid in Lithuania do not reflect the company’s overall revenue performance.
Changes in taxes paid can help forecast a company’s revenue trends. However, a more reliable assessment requires consideration of the company’s business characteristics and other financial and operational indicators. It is particularly useful to examine monthly tax payment data for the current year to identify any unusual or one-off payments that did not occur in previous years and may distort the overall growth rate.
PLY Insights’ Lithuanian company analytics brings financial, tax and other company performance indicators together in one place. This helps users identify business trends earlier, make preliminary revenue forecasts and take data-driven decisions before the latest financial statements are published.


