

Competitor analysis: what does the data reveal about your competitors and your market position?
Competitor analysis helps you understand the key market players, assess their performance, and evaluate your company’s position relative to them. When analyzing competitors, it is also worth looking at the broader market – its size, structure, and key trends. Such an analysis can help answer several practical questions:
- What does the market structure look like?
- Who are our main competitors?
- Which competitors are the largest?
- Which market players are growing the fastest?
- How are competitors’ financial metrics changing?
- Which competitors are the most profitable?
- How do our financial metrics compare with the market?
Many of these questions can be answered using publicly available company data. The first step is to define which companies are genuinely relevant to compare your business with, and then select the metrics that best reflect their size, growth, profitability, and other aspects of business performance.
It is important to understand that competitor analysis is not a one-off exercise of compiling a list of competitors or comparing their results. Companies’ positions are constantly changing: some grow rapidly, others see their performance decline, new players enter the market, and financial results are also affected by changes in the broader economic environment. For this reason, the competitive landscape should be assessed periodically, tracking how the market evolves, how key competitors perform, and how your company’s position changes relative to them.
Start with an overall view of the competitive landscape
Before analyzing specific companies, it is worth first defining the market and assessing its overall trends. This provides a benchmark that can later be used to evaluate the performance of individual competitors and your own company more objectively.
Define the market you want to analyze
The results of competitor analysis depend heavily on which companies are included. A sample that is too broad may combine companies with very different business profiles, while one that is too narrow may fail to provide sufficient market context.
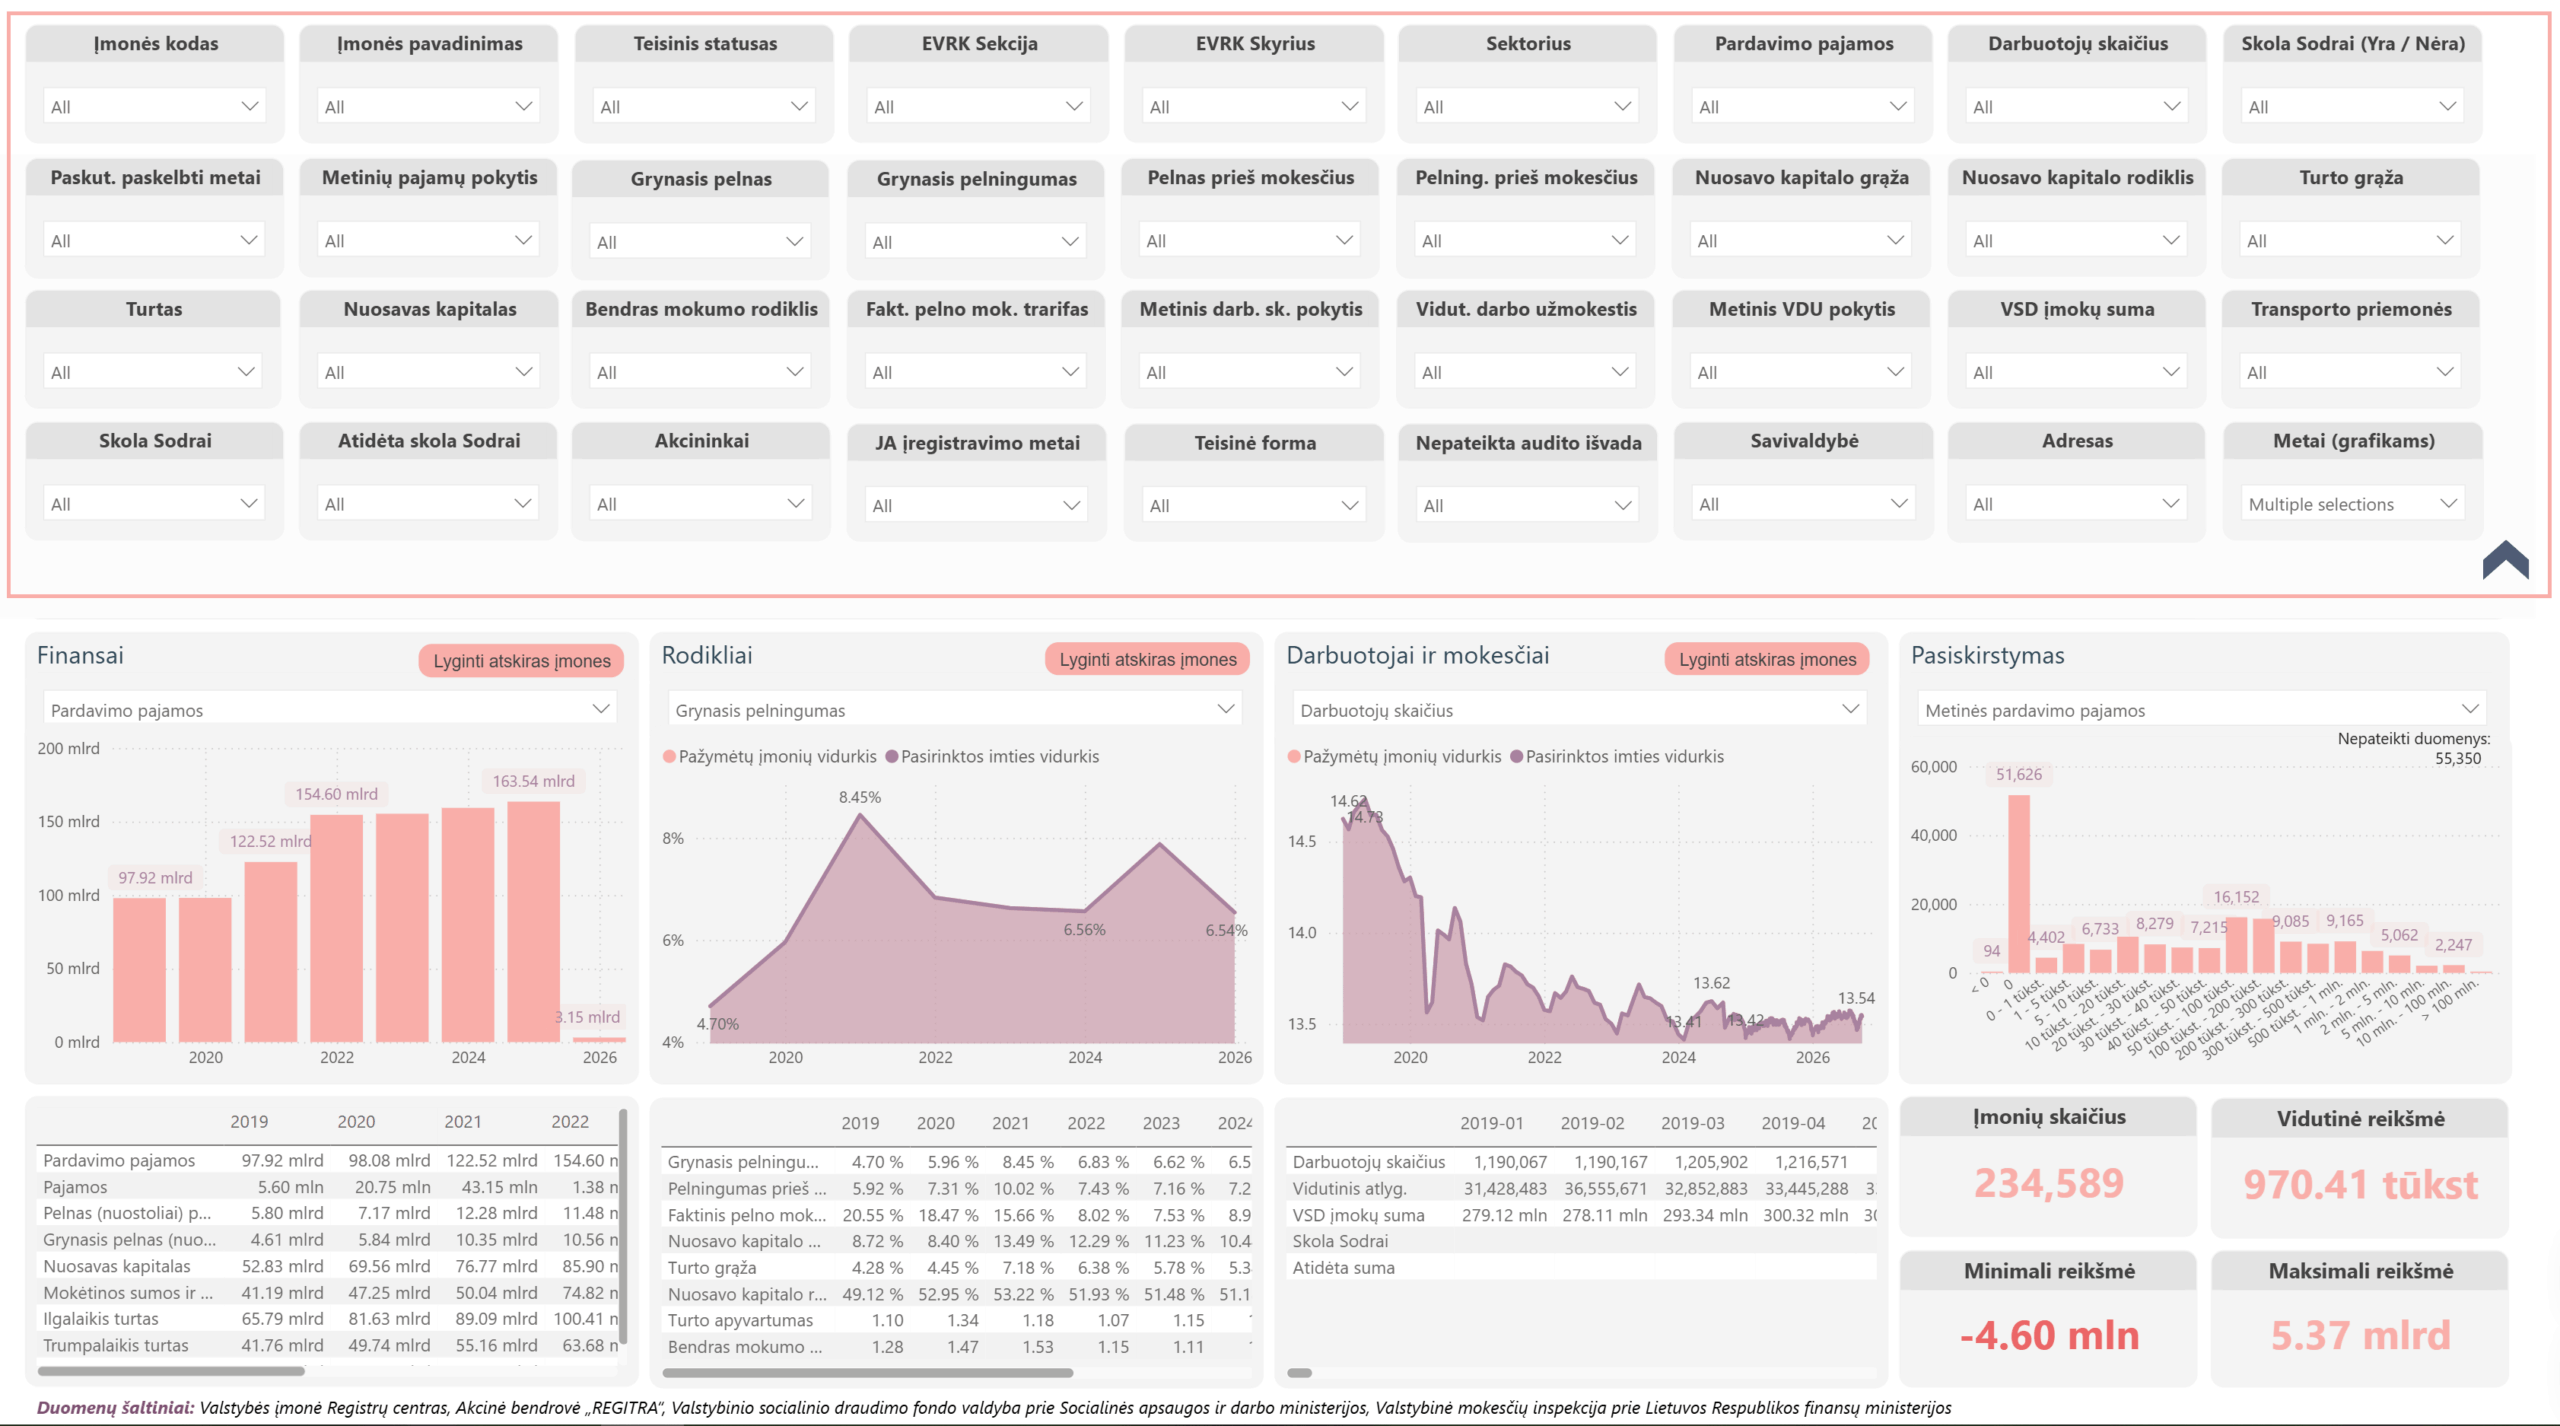
In PLY Insights’ Lithuanian, Latvian, and Estonian company analytics, the market sample can be refined step by step. In the company analytics, it can be narrowed down by EVRK section, EVRK division, and sector. This makes it possible to move from a broad area of economic activity to a more specific group of companies.
The market can then be narrowed further by company size, combining annual sales revenue, number of employees, company assets, and other metrics. The sample can also be refined by geographic location, financial condition, outstanding liabilities, and other criteria relevant to the specific analysis.
For example, instead of analyzing all companies in a selected sector, you could focus only on companies with annual sales revenue of €1–5M, 10–50 employees, and operations in a selected municipality. Such a sample may more accurately reflect the market segment in which your company operates.
Assess how market metrics are distributed
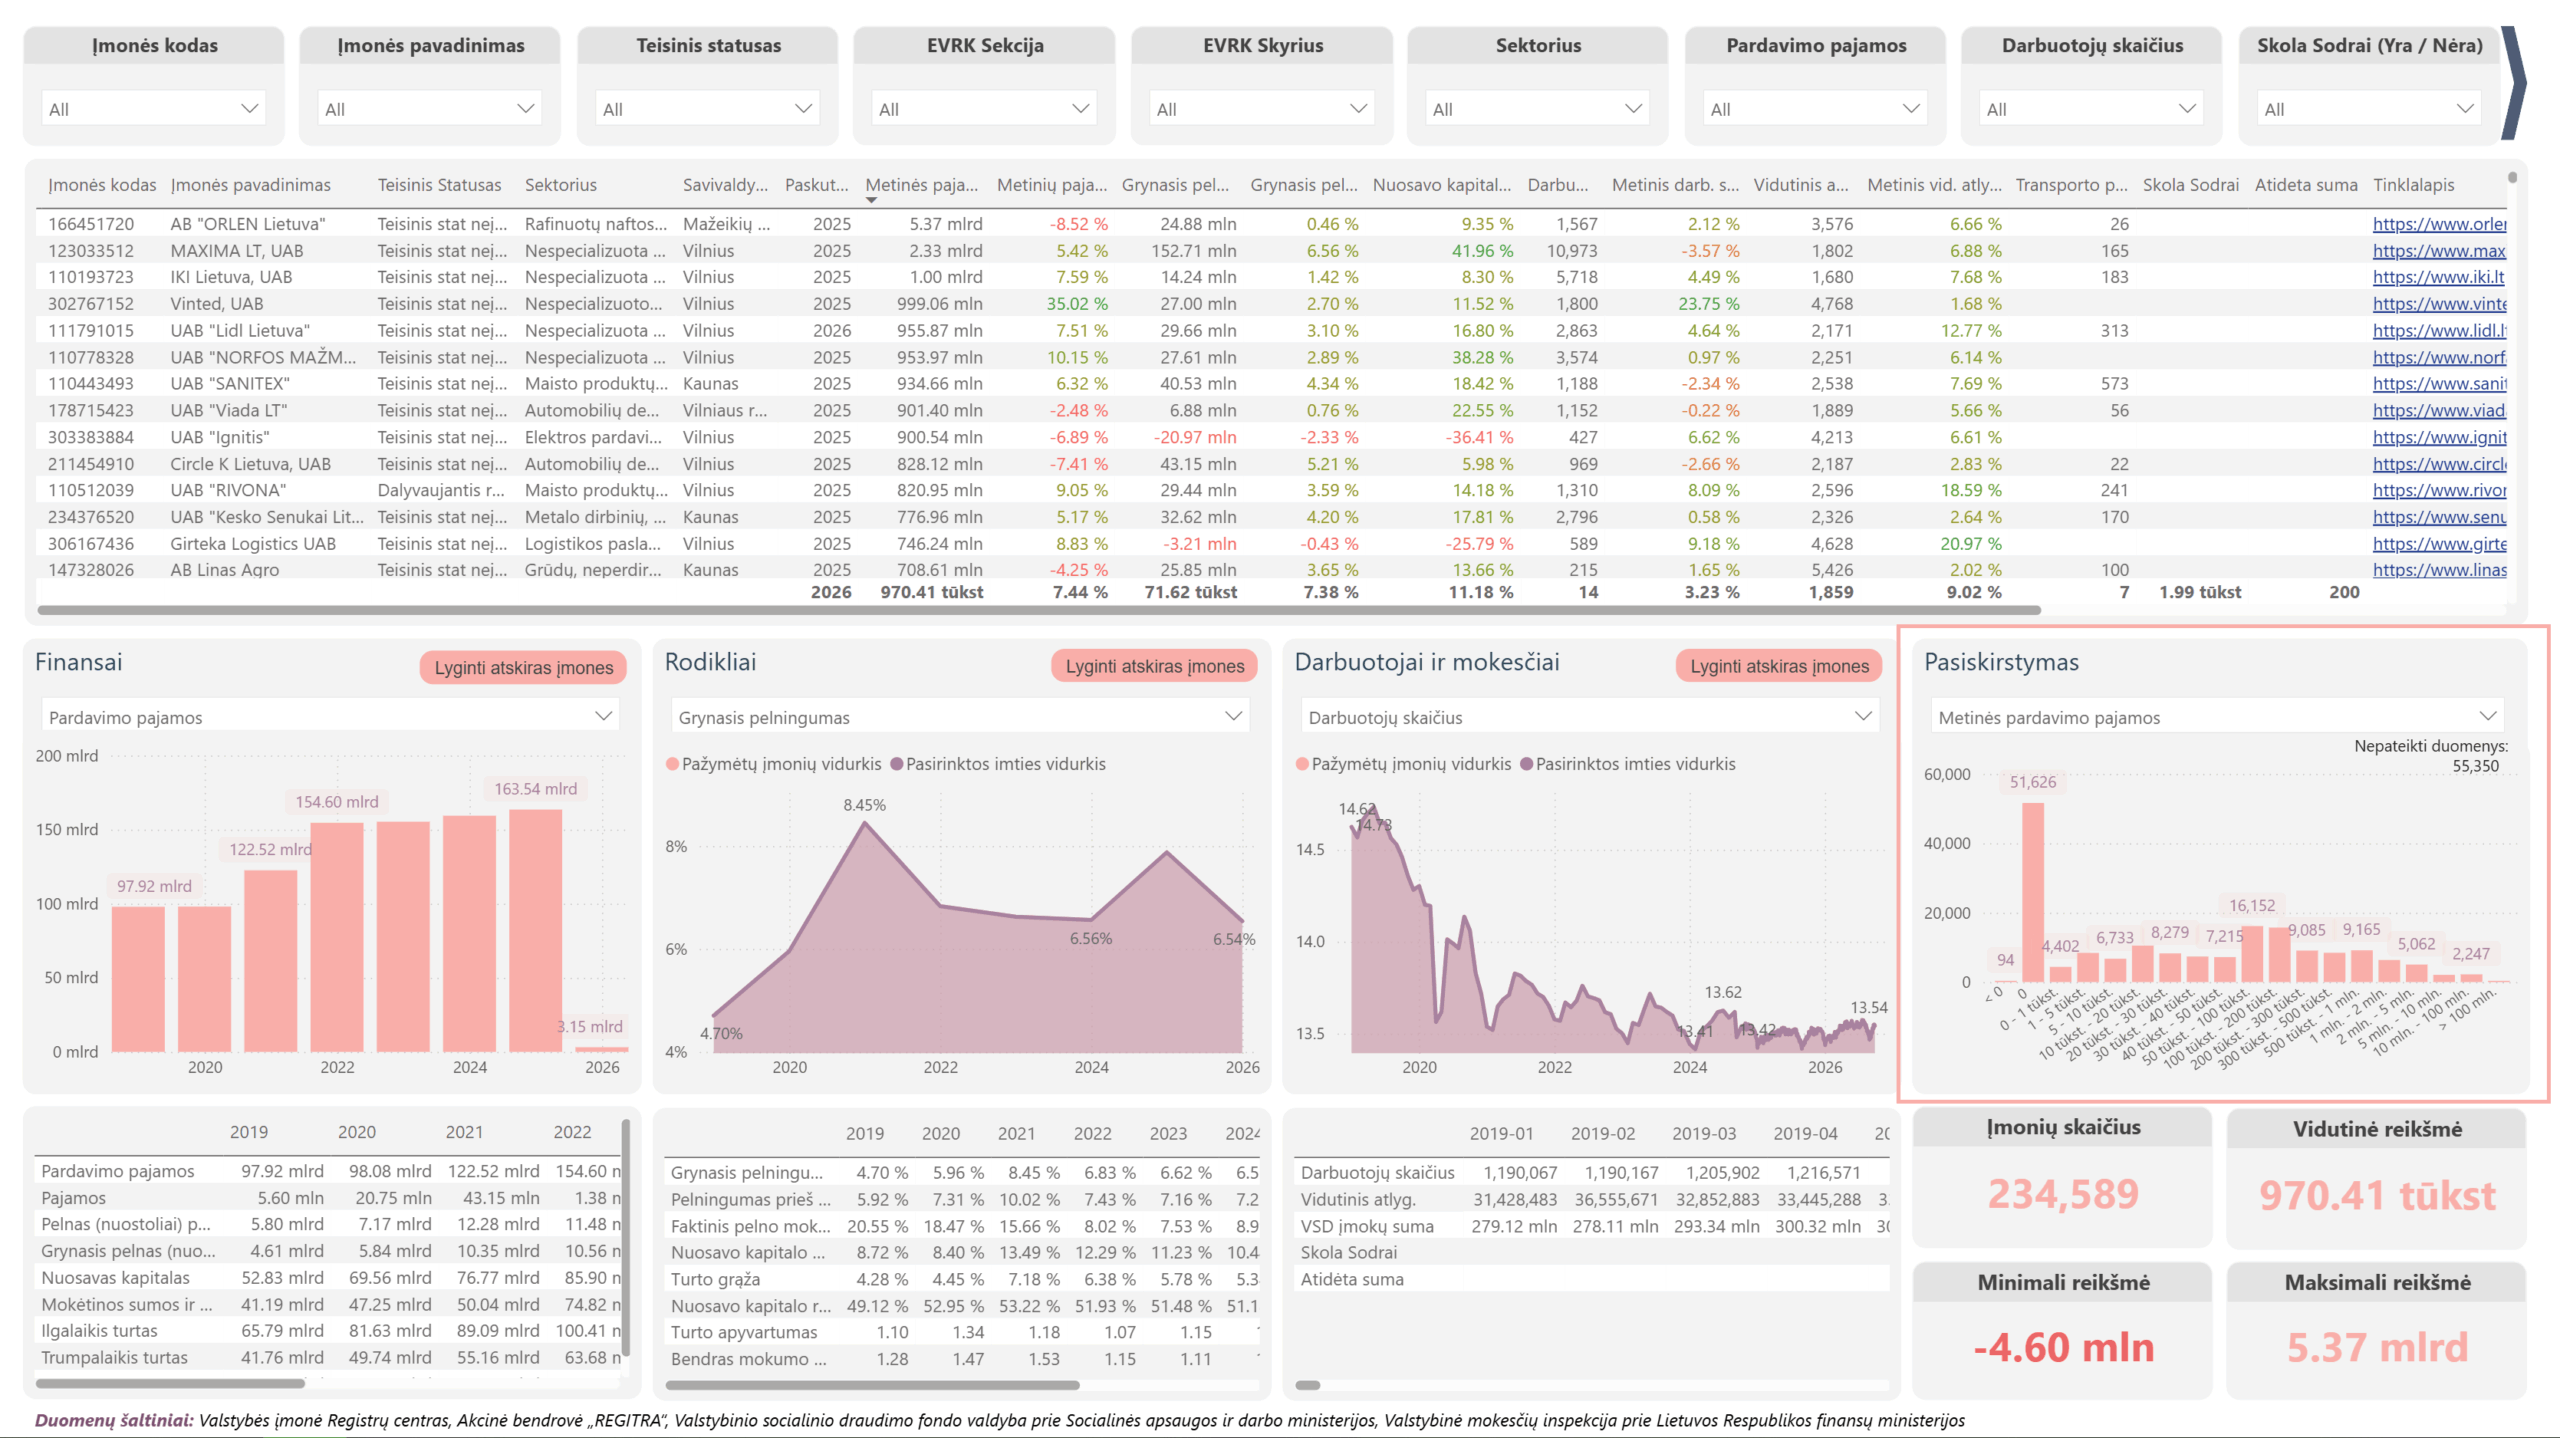
If it is not clear how best to segment the market by company size, it is worth first looking at the actual distribution of companies.
In the PLY Insights “Distribution” chart, you can see how many companies in the selected sample fall within different sales revenue ranges. This makes it possible to quickly assess whether the market is dominated by smaller companies, how many medium-sized and large companies operate in it, and which range your business falls into.
The distribution can also be analyzed using other metrics, such as revenue growth, net profit, net profit margin, return on equity, number of employees, and others. For example, you can see what proportion of companies in the market operate with a 1–5% net profit margin and how many achieve higher results.
This provides more context than the overall market average alone – you can see not only what a typical result looks like, but also how widely company metrics are distributed across the market.
Analyze market trends over time
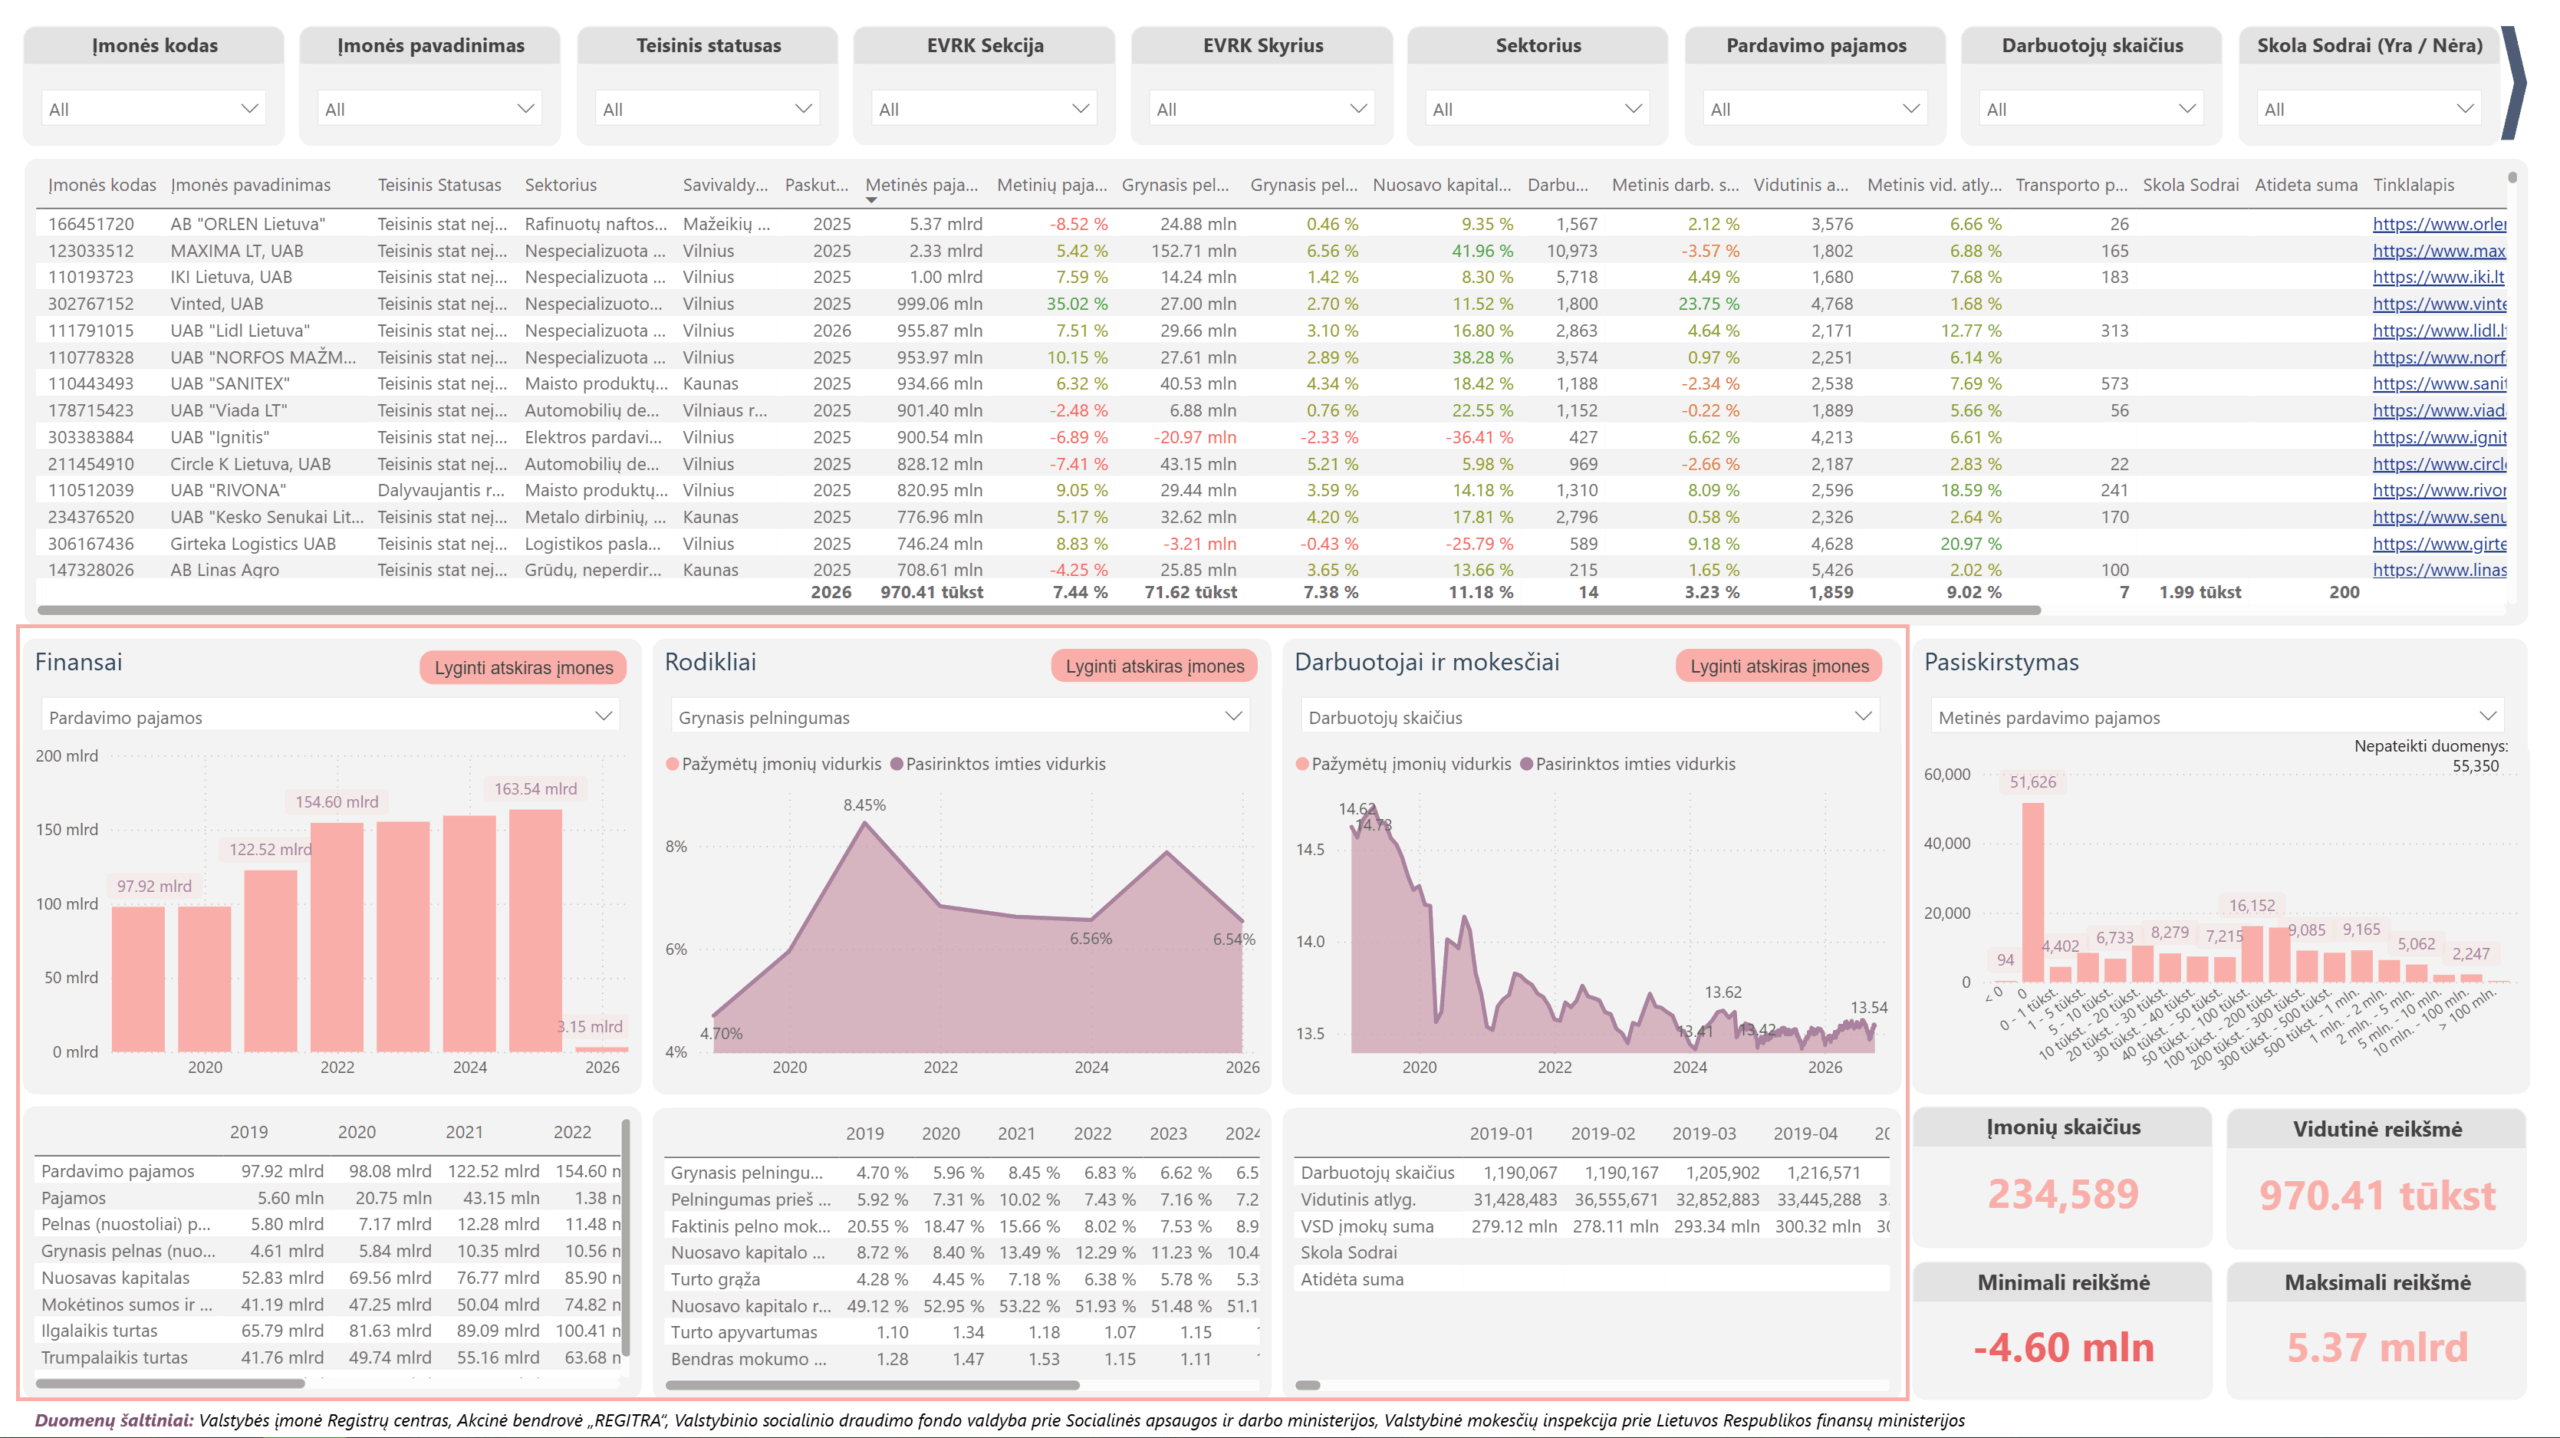
Once a relevant sample of companies has been defined, you can assess how their performance has changed over several years.
PLY Insights allows you to analyze trends in sales revenue, profit, profitability, return on equity, number of employees, average salary, and other metrics. This helps distinguish a one-year result from a longer-term market trend.
Overall metrics for the selected market segment help provide a clearer picture of what results are typical and how the market itself is changing. For example, you can assess the level of profitability typically achieved by companies in a selected sector, how their revenue and other key metrics change over time, and whether the sector is growing, declining, or remaining relatively stable. Looking at data over several years makes it easier to distinguish broader market trends from one-year fluctuations that may be influenced by prevailing economic conditions or other short-term factors.
Assess your company’s position in the context of competitors
Once you have defined the market sample for your analysis, you can move from overall market trends to assessing your company’s position. It is worth first looking at how your company’s performance compares within the context of the selected market, and then comparing it with specific competitors.
How does your company’s performance compare with the market?
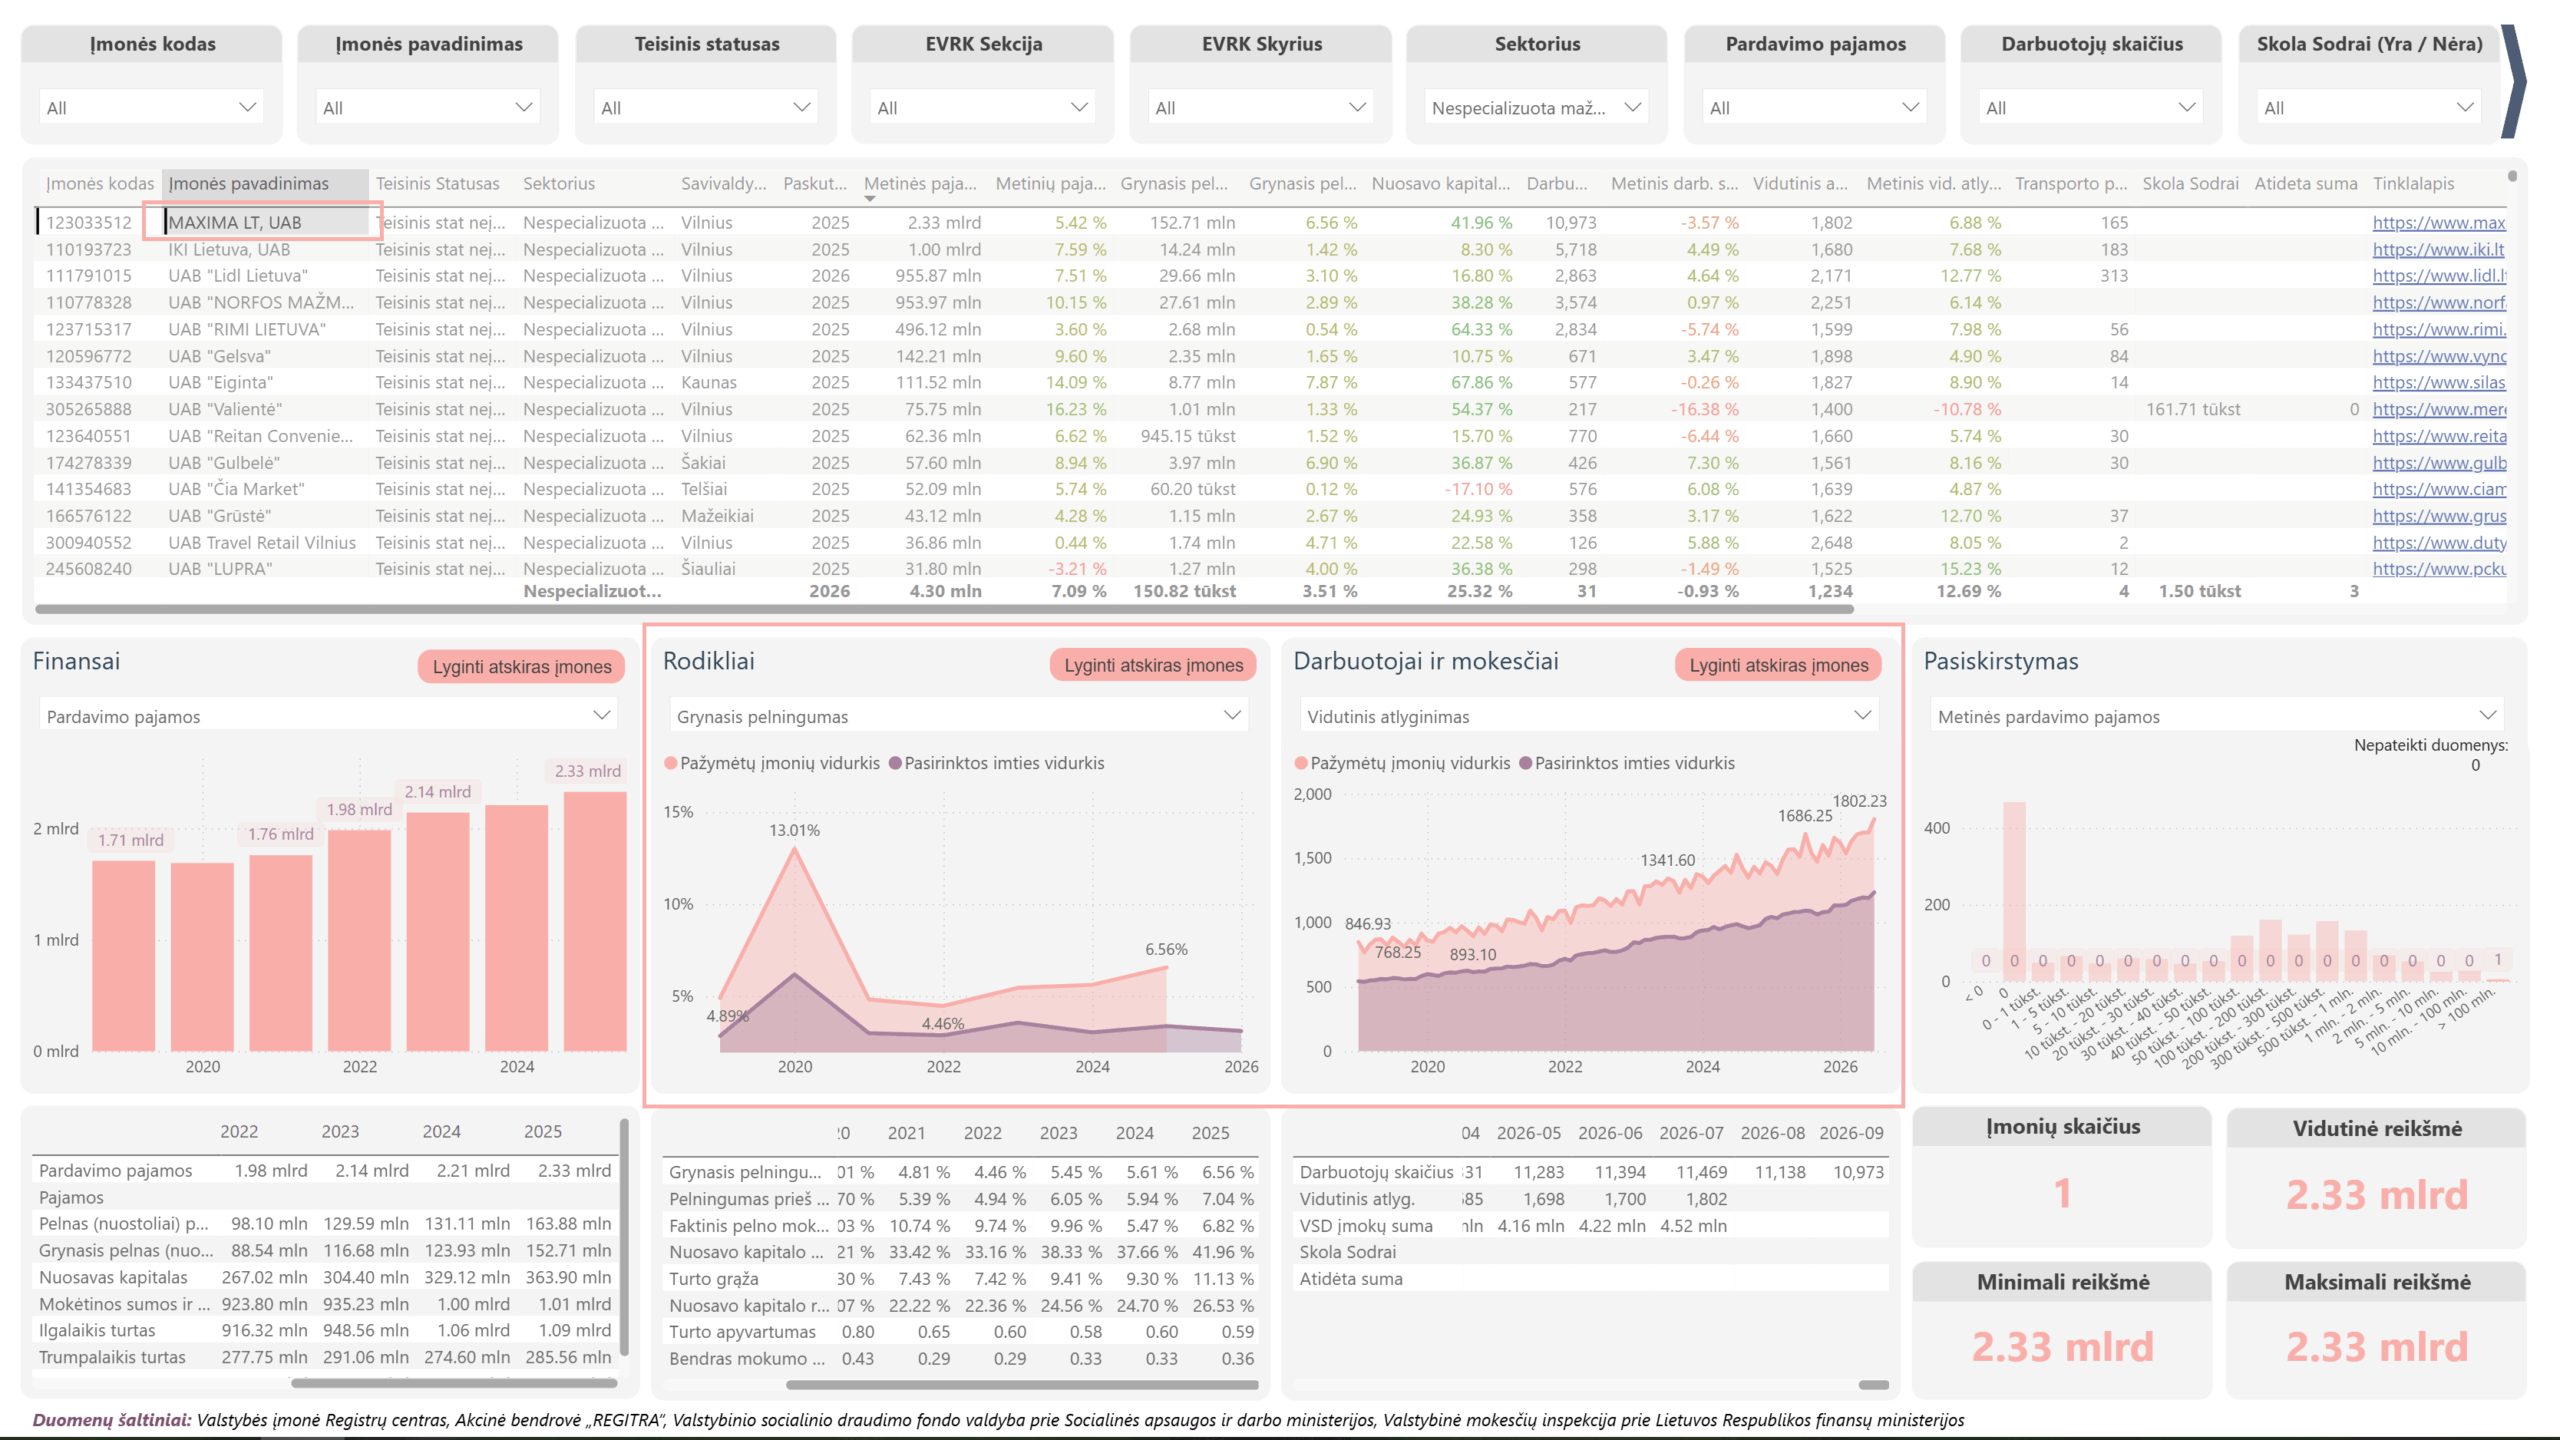
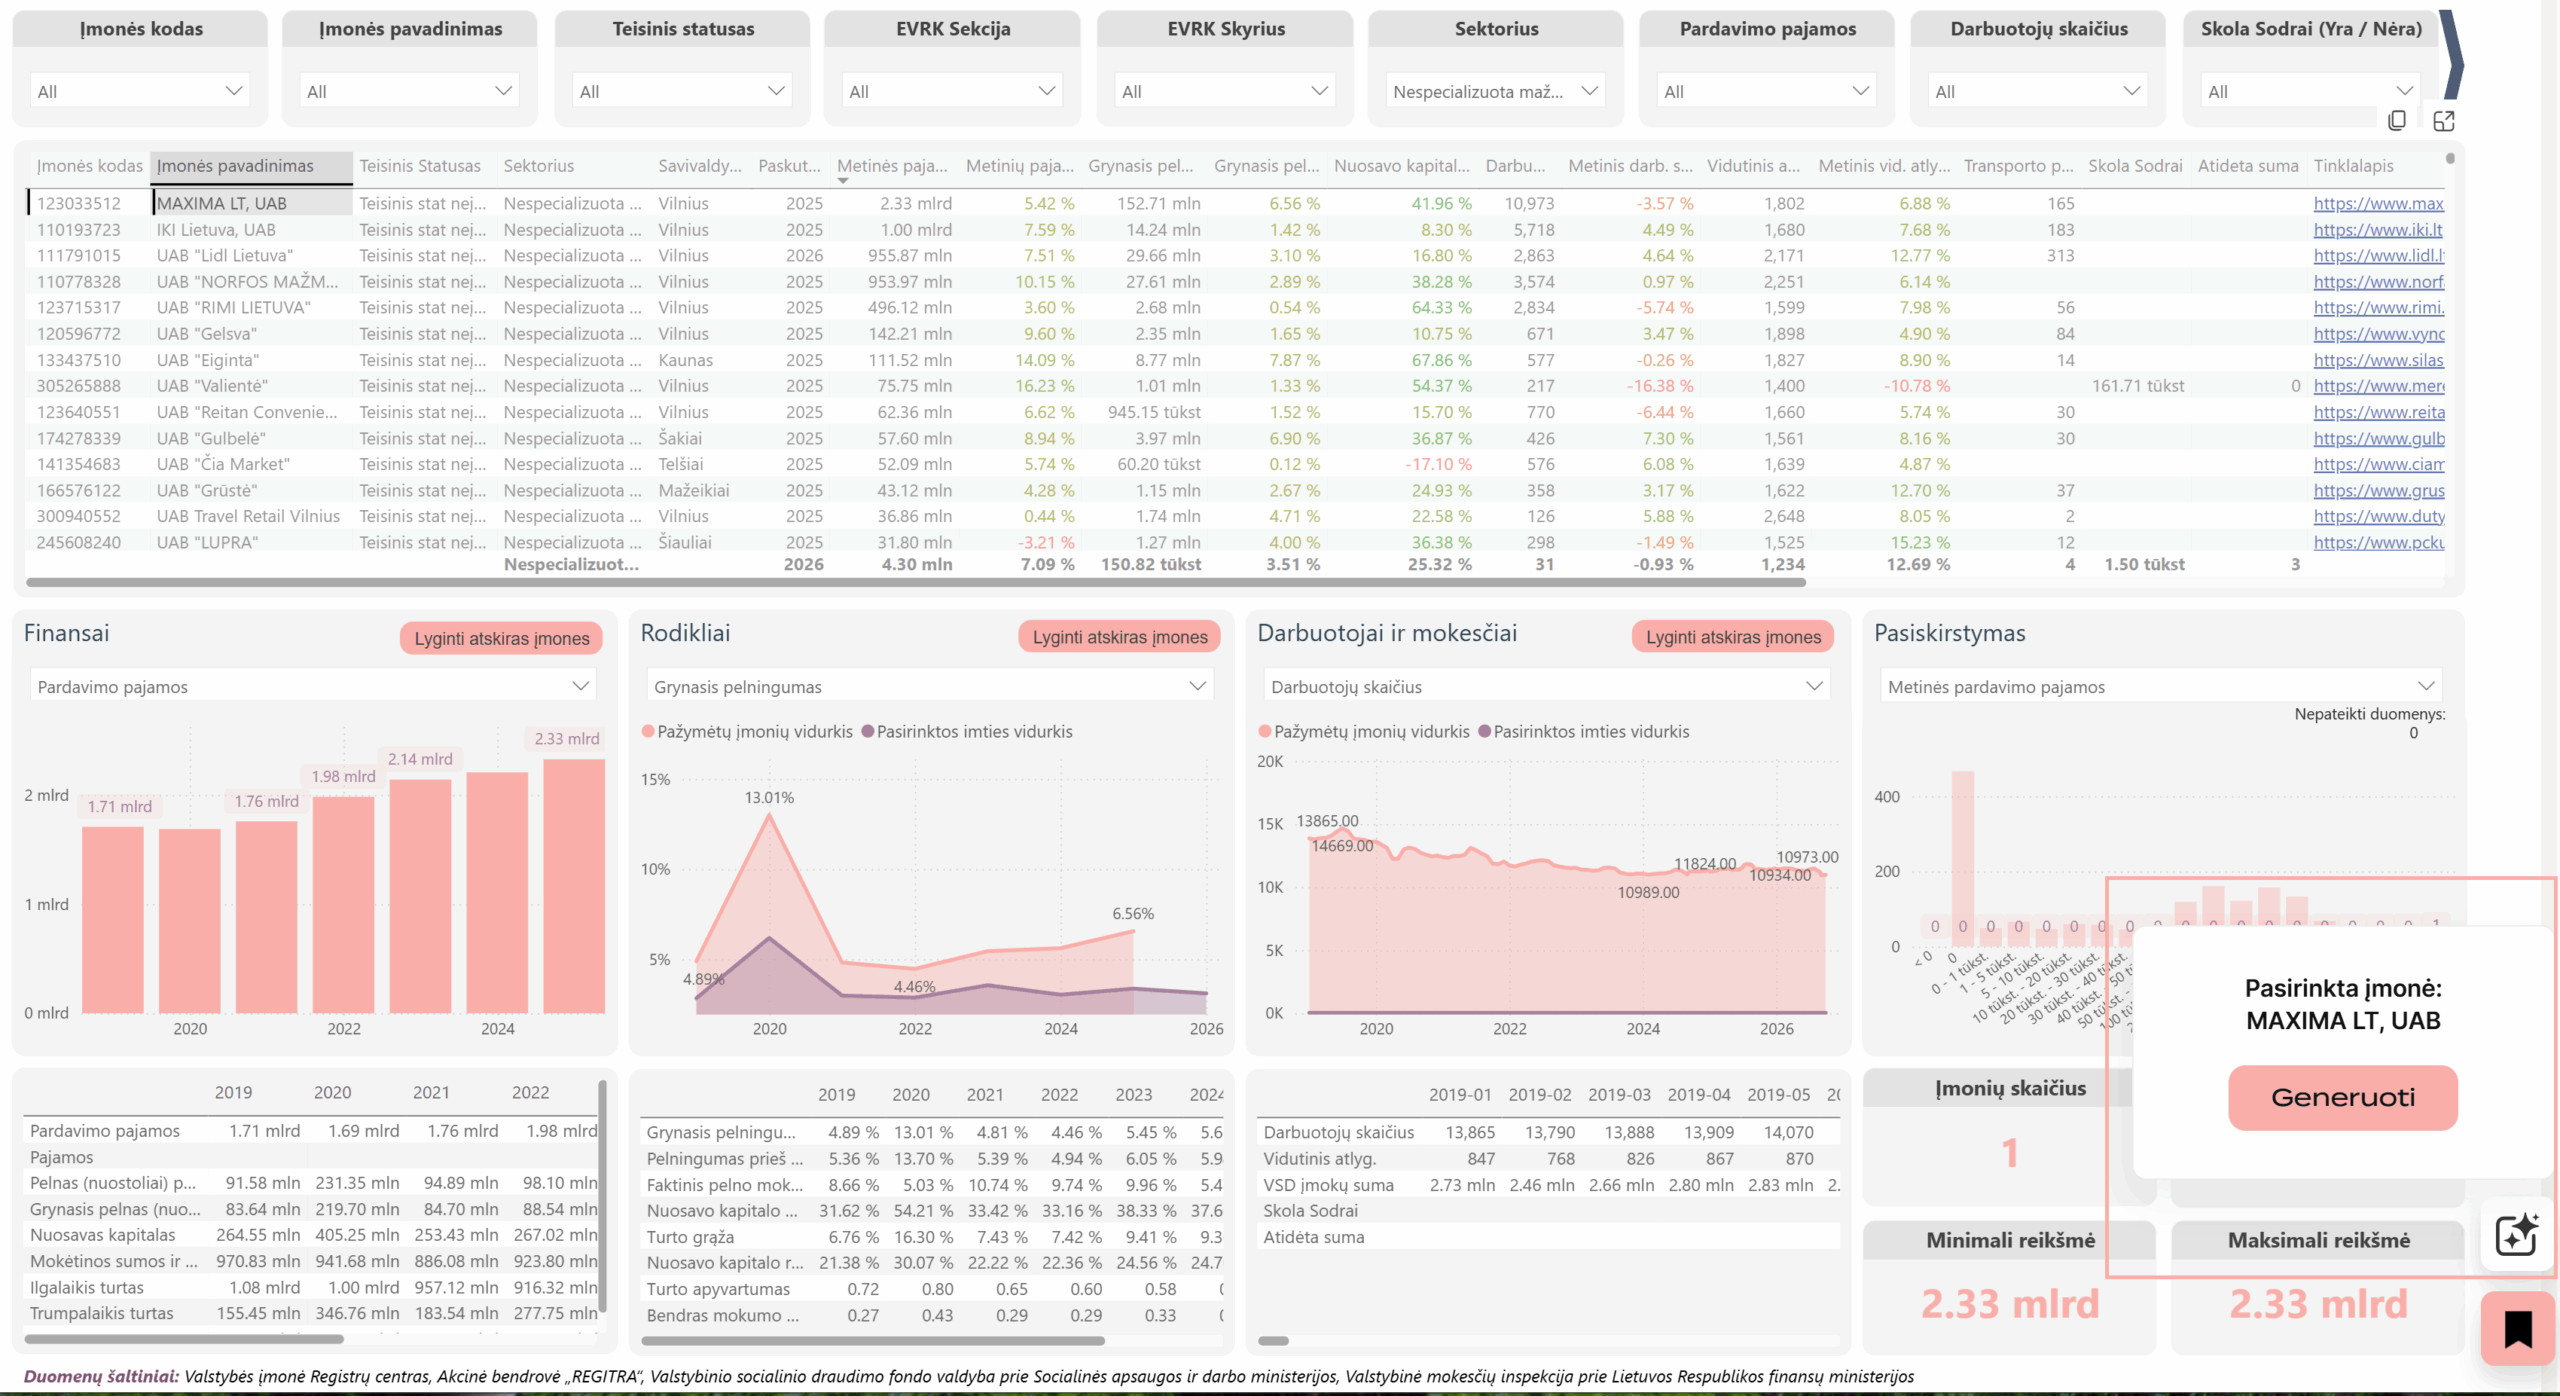
In the PLY Insights company table, you can select a specific company – for example, your own – and compare its performance with the averages of the filtered company sample. This is important because the benchmark is not all companies in Lithuania or even an entire broad sector, but the market you defined in the previous step.
PLY Insights charts allow you to analyze different groups of metrics, including financial metrics, employee numbers and salary data, as well as information related to taxes and outstanding liabilities. This comparison helps you assess not only how specific metrics are changing, but also how your company’s operating performance compares with that of similar market participants.
For example, a company’s sales revenue may increase by 8% over a year. Viewed in isolation, this may appear to be a positive result. However, if the revenues of comparable companies in the market grew by an average of 15% over the same period, the result takes on a very different context.
Profitability can also vary significantly across sectors. A result that is considered high in one sector may be entirely typical or even relatively low in another. Therefore, when assessing your company’s profitability, it is important to compare it with the results of companies operating in a similar market.
Move from market averages to specific competitors
The market average provides a useful benchmark, but it can hide significant differences between individual companies. Operating in a similar business area does not necessarily mean that companies are direct competitors, so the next step is to select several of your closest competitors and compare their performance directly.
Before selecting specific companies for comparison, you can learn more about their activities through PLY Insights’ AI-generated company overview. It provides a quick introduction to the selected company and additional context to help determine which companies are most relevant for further competitor analysis.
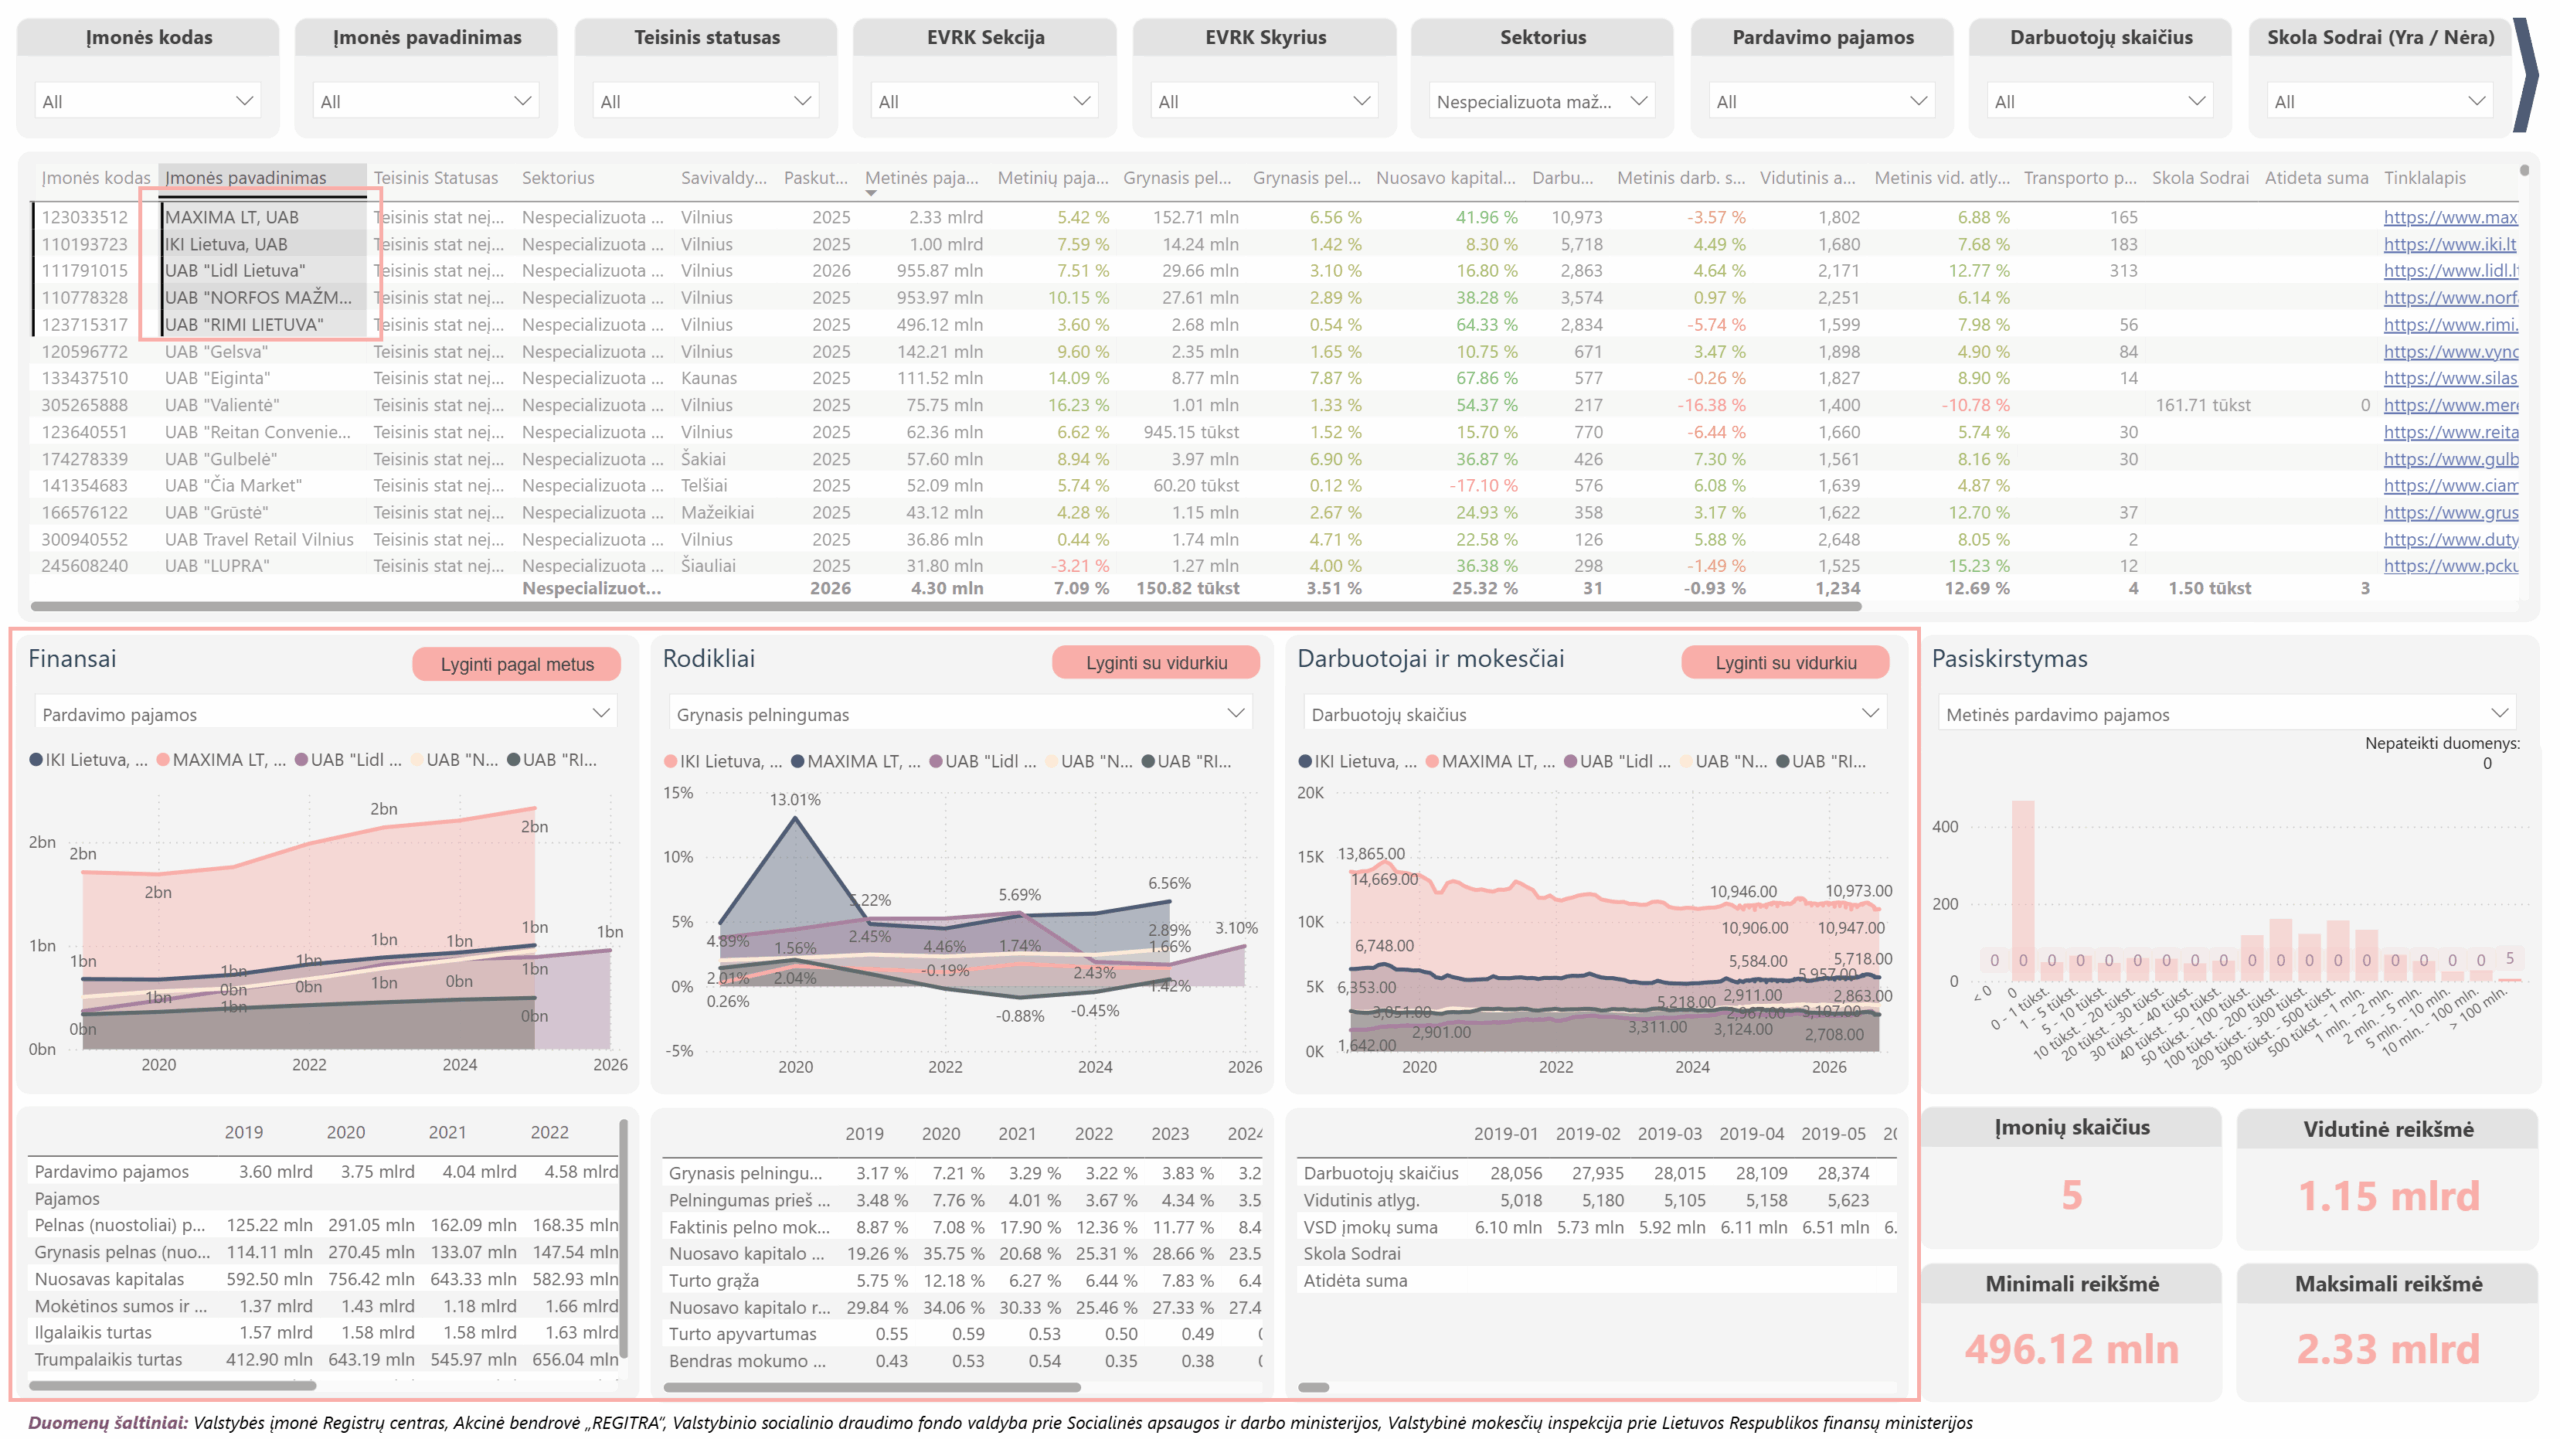
Once the most relevant competitors have been identified, you can proceed to directly compare their performance metrics. PLY Insights charts can be switched to “Compare Companies” mode. By holding down the CTRL key in the company table, you can select multiple companies, display their metrics on the same chart, and track how they have changed over different periods.
You can then compare your company with specific competitors based on:
- sales revenue and its growth;
- net profit and profitability;
- return on equity (ROE) or return on assets (ROA);
- number of employees and changes in headcount, or average salary;
- other financial or operational metrics relevant to the analysis.
It is particularly useful to look not only at the latest annual figures but also at trends over several years. Companies of a similar size may look very similar today, while their development trajectories can be entirely different.
For example, one competitor’s revenue may grow steadily alongside profitability, while another may see revenue increase but profitability decline. A third company’s revenue may remain almost unchanged even as its number of employees grows rapidly. These differences can reveal changes that may not be visible from the latest annual results alone.
This makes it worth asking: Which competitor is growing the fastest? Which is the most profitable? How is their number of employees changing? Is revenue growth accompanied by higher profitability? And how does your company’s trajectory compare with those of its competitors?
Enhance competitor analysis with non-financial data
Financial metrics allow you to compare competitors in terms of size, growth, profitability, and operating efficiency, but they do not always reveal the full picture of a company’s operations. Depending on the sector, competitor analysis can be enhanced with other data that may provide additional insights into the scale of competitors’ operations, their resources, or their customers.
For this purpose, PLY Insights provides Lithuanian vehicle and public procurement analytics.
What can competitors’ vehicle fleets reveal about them?
Vehicle data can provide additional insights into competitors for whom a vehicle fleet is an important part of their operations. This is particularly relevant in transport, logistics, and other sectors where the number of vehicles and changes in fleet size can help provide a better understanding of a company’s scale of operations and direction of expansion.
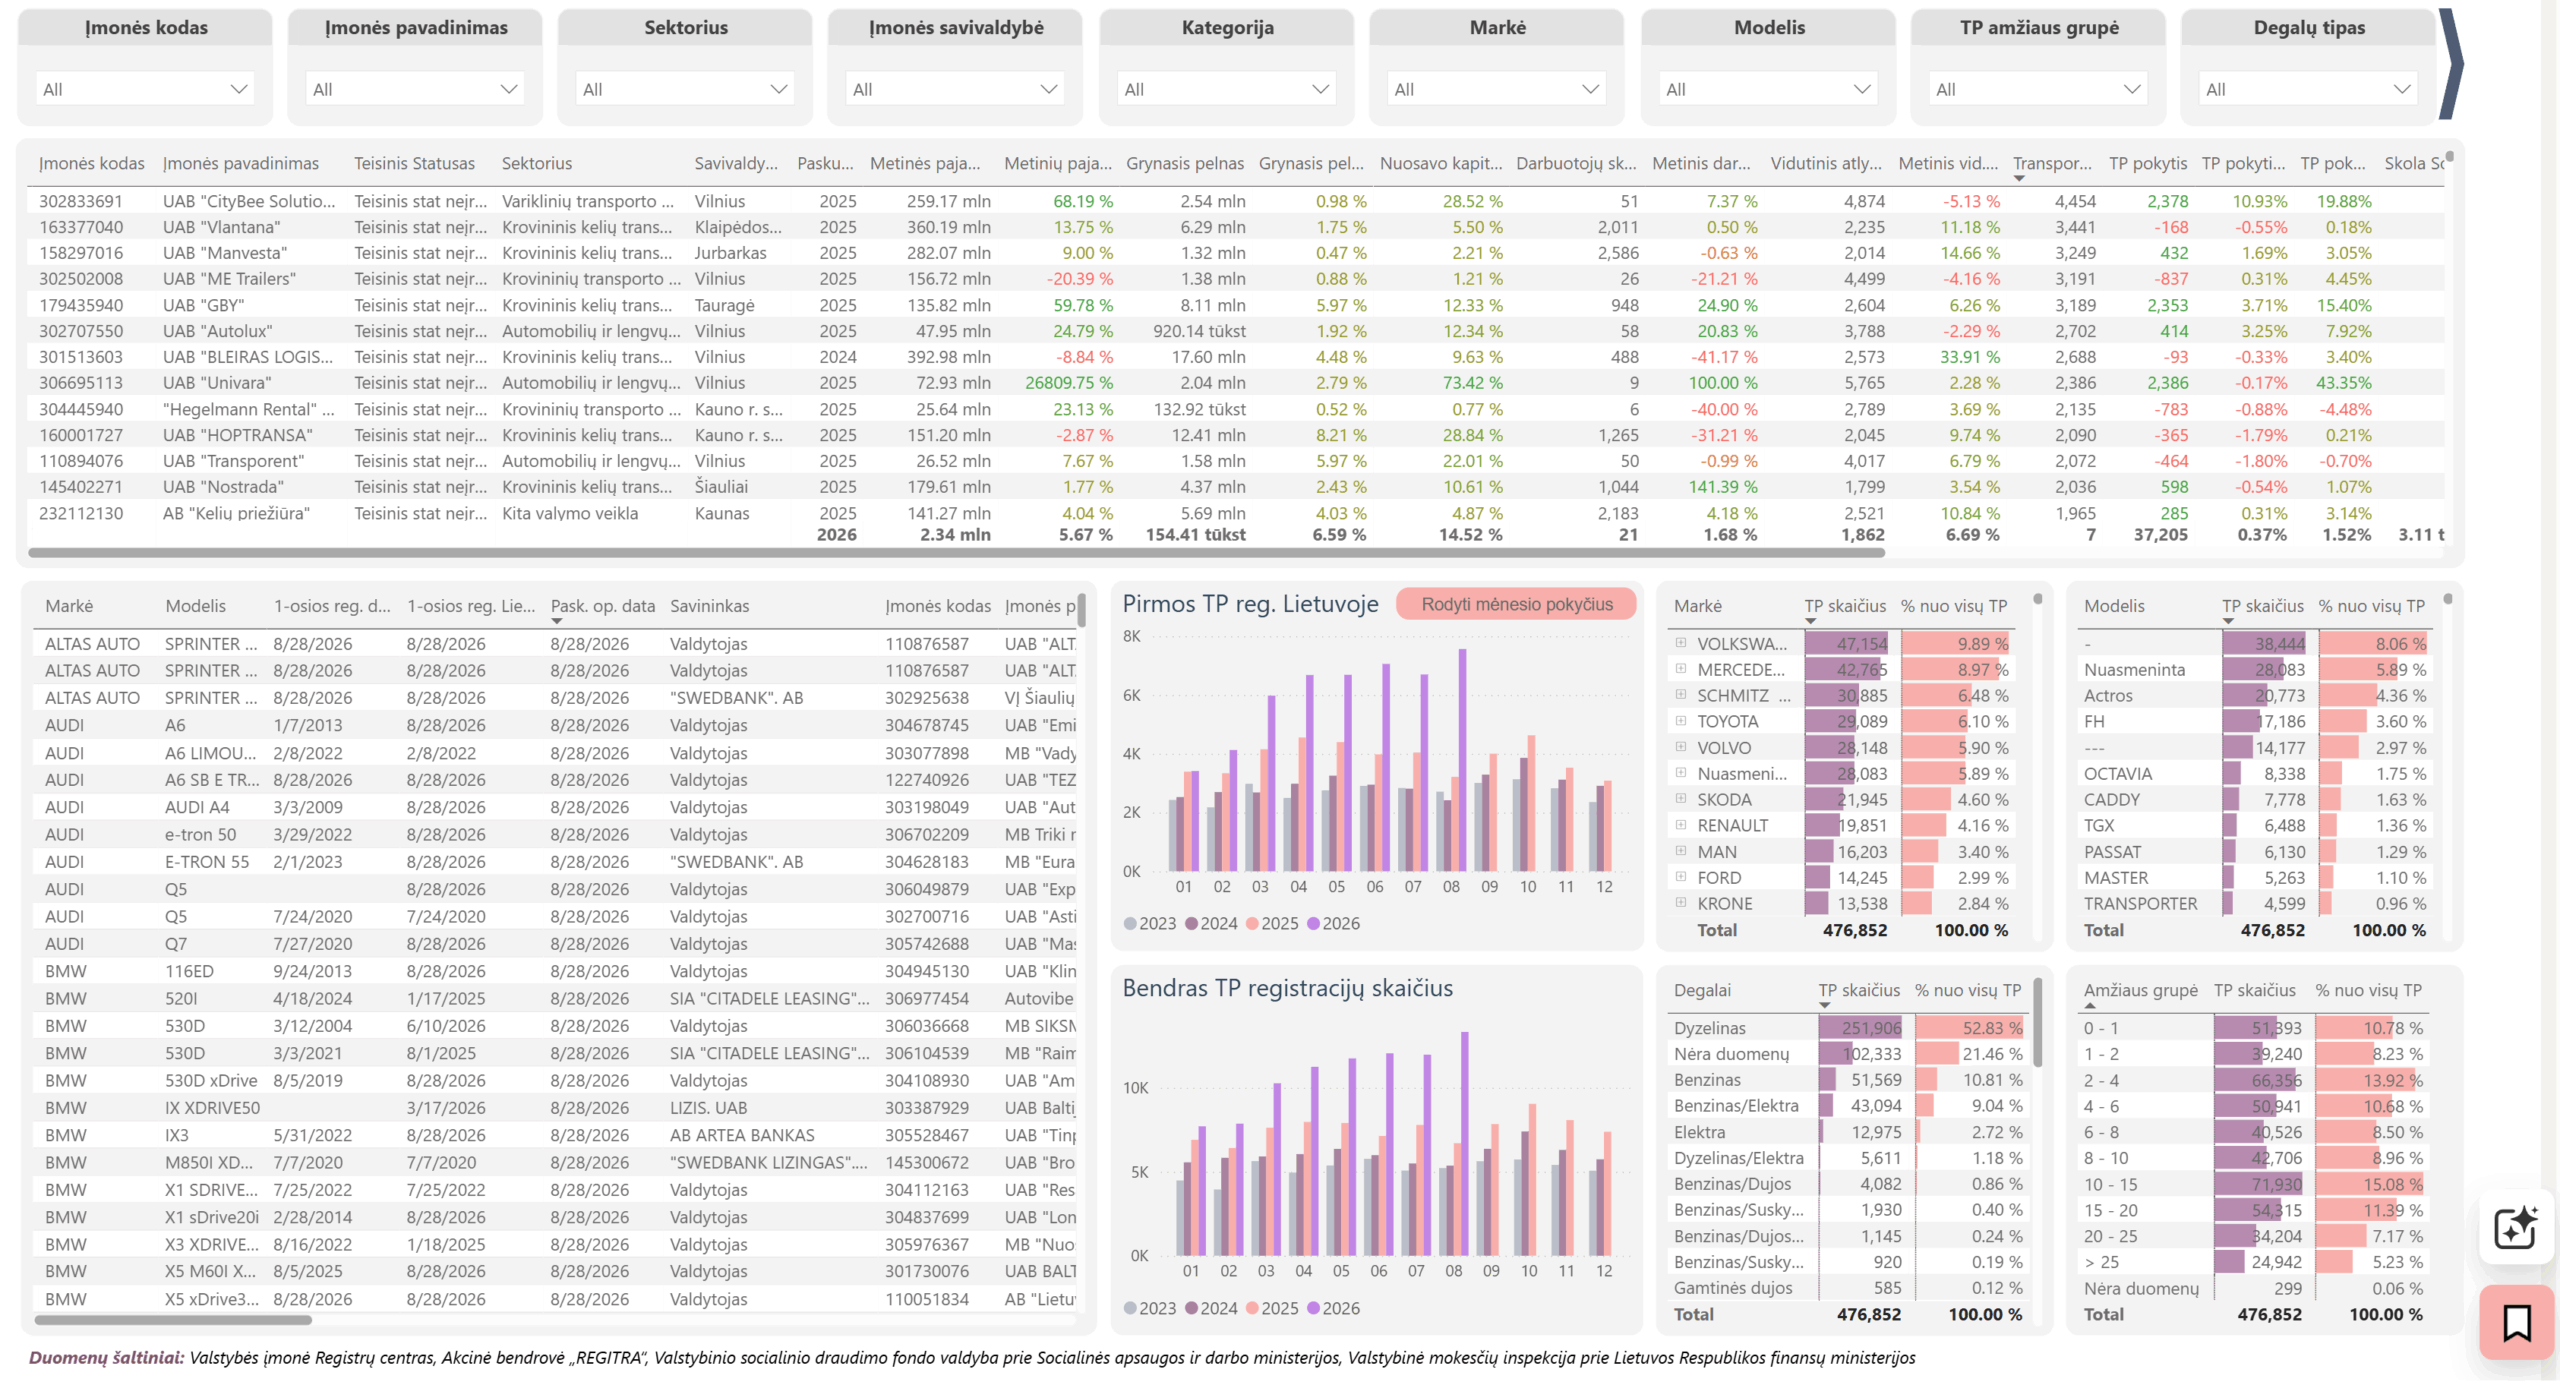
Using PLY Insights Lithuanian vehicle analytics, you can analyze competitors’ vehicle fleets and assess vehicles by make, model, age, length of ownership or use, and other characteristics.
For example, two logistics companies generating similar revenues may have very different vehicle fleets. One may operate a larger and newer fleet, while the other may have a smaller or older one. These differences alone do not indicate which company operates more efficiently, but when combined with financial and employee data, they can provide a more comprehensive view of competitors’ scale of operations and business models.
Changes in vehicle fleets can reveal even more. If a competitor significantly increases the number of vehicles in its fleet over a short period, this may be one signal that the company is increasing its operating capacity or preparing for expansion. If the number of employees, revenue, or other operating metrics are also growing at the same time, this can provide a clearer picture of the competitor’s growth trajectory.
Public procurement analysis can help identify new opportunities
If your company or its competitors work with the public sector, public procurement data can provide additional insights into the competitive landscape.
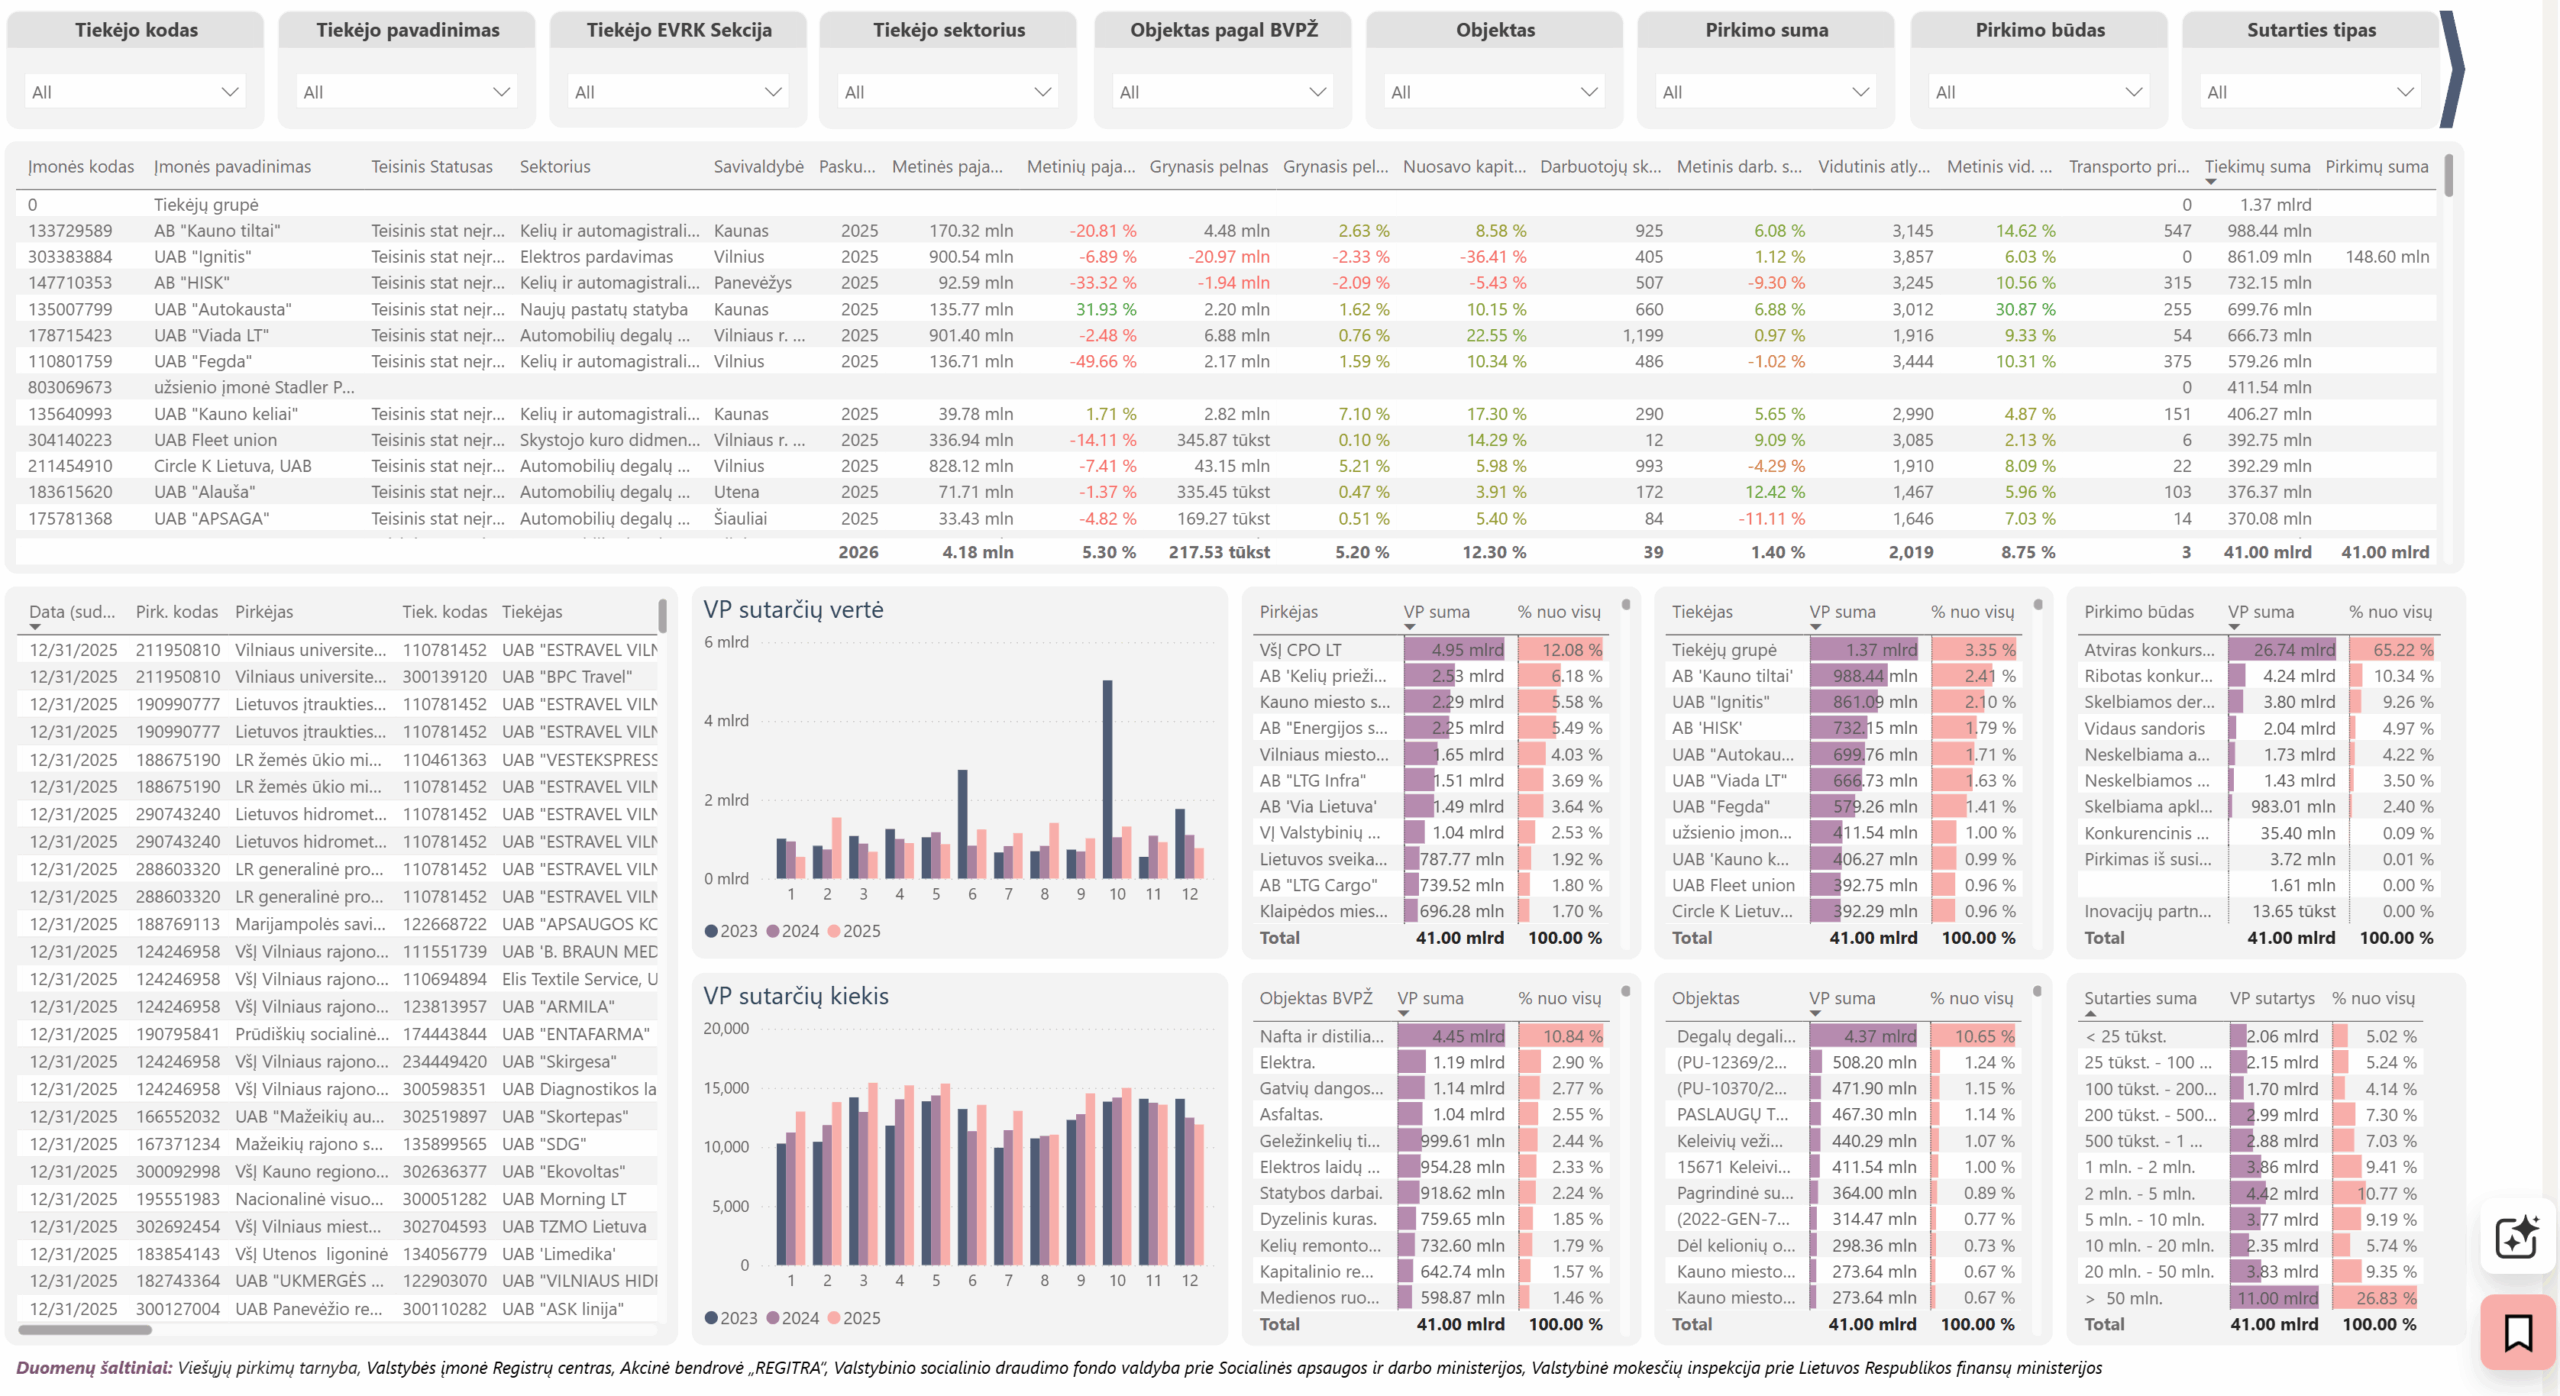
In PLY Insights public procurement analytics, data can be filtered by buyers, suppliers, business areas, procurement objects, contract values, and other criteria. This makes it possible to analyze both the activities of specific competitors and the broader public procurement market relevant to your business.
When analyzing a specific competitor, you can see which public procurements they participate in, what goods or services they provide, which organizations they work with, and the value of the contracts they are awarded. This can help you better understand the competitor’s areas of activity and position in the public sector, while also identifying contracting authorities and procurement opportunities that may be relevant to your company.
At the same time, you can assess the overall situation within a selected segment – how active the public procurement market is for particular goods or services, which organizations purchase them, which companies supply them, and the value of the contracts awarded.
Historical data can also help identify recurring trends. For example, if a particular organization regularly purchases services provided by your company, you can track its procurement activity and assess opportunities to participate in similar public procurements in the future. In this way, public procurement analytics can help you not only better understand competitors’ activities, but also assess public-sector demand and identify potential business opportunities.
What should you keep in mind when conducting competitor analysis?
The purpose of competitor analysis is not simply to compile a list of similar companies or compare their latest annual sales revenue. A broader approach provides more value: first, define the relevant market and understand its structure and trends, and then assess your company’s performance and that of specific competitors within this context.
Financial data should be analyzed together – looking not only at revenue, but also at revenue growth, profitability, returns on capital, changes in employee numbers, and other metrics relevant to the business. Depending on the sector, this picture can be complemented by vehicle, public procurement, and other data.
Most importantly, competitor analysis should not be a one-off exercise. Company performance and market positions change over time, so conducting comparisons periodically can help identify which competitors are strengthening their positions, how the market itself is changing, and how your company’s position is evolving within it. In PLY Insights, you can save a selected list of competitors and return to it later with a single click, making it easy to monitor changes among selected companies on a regular basis.
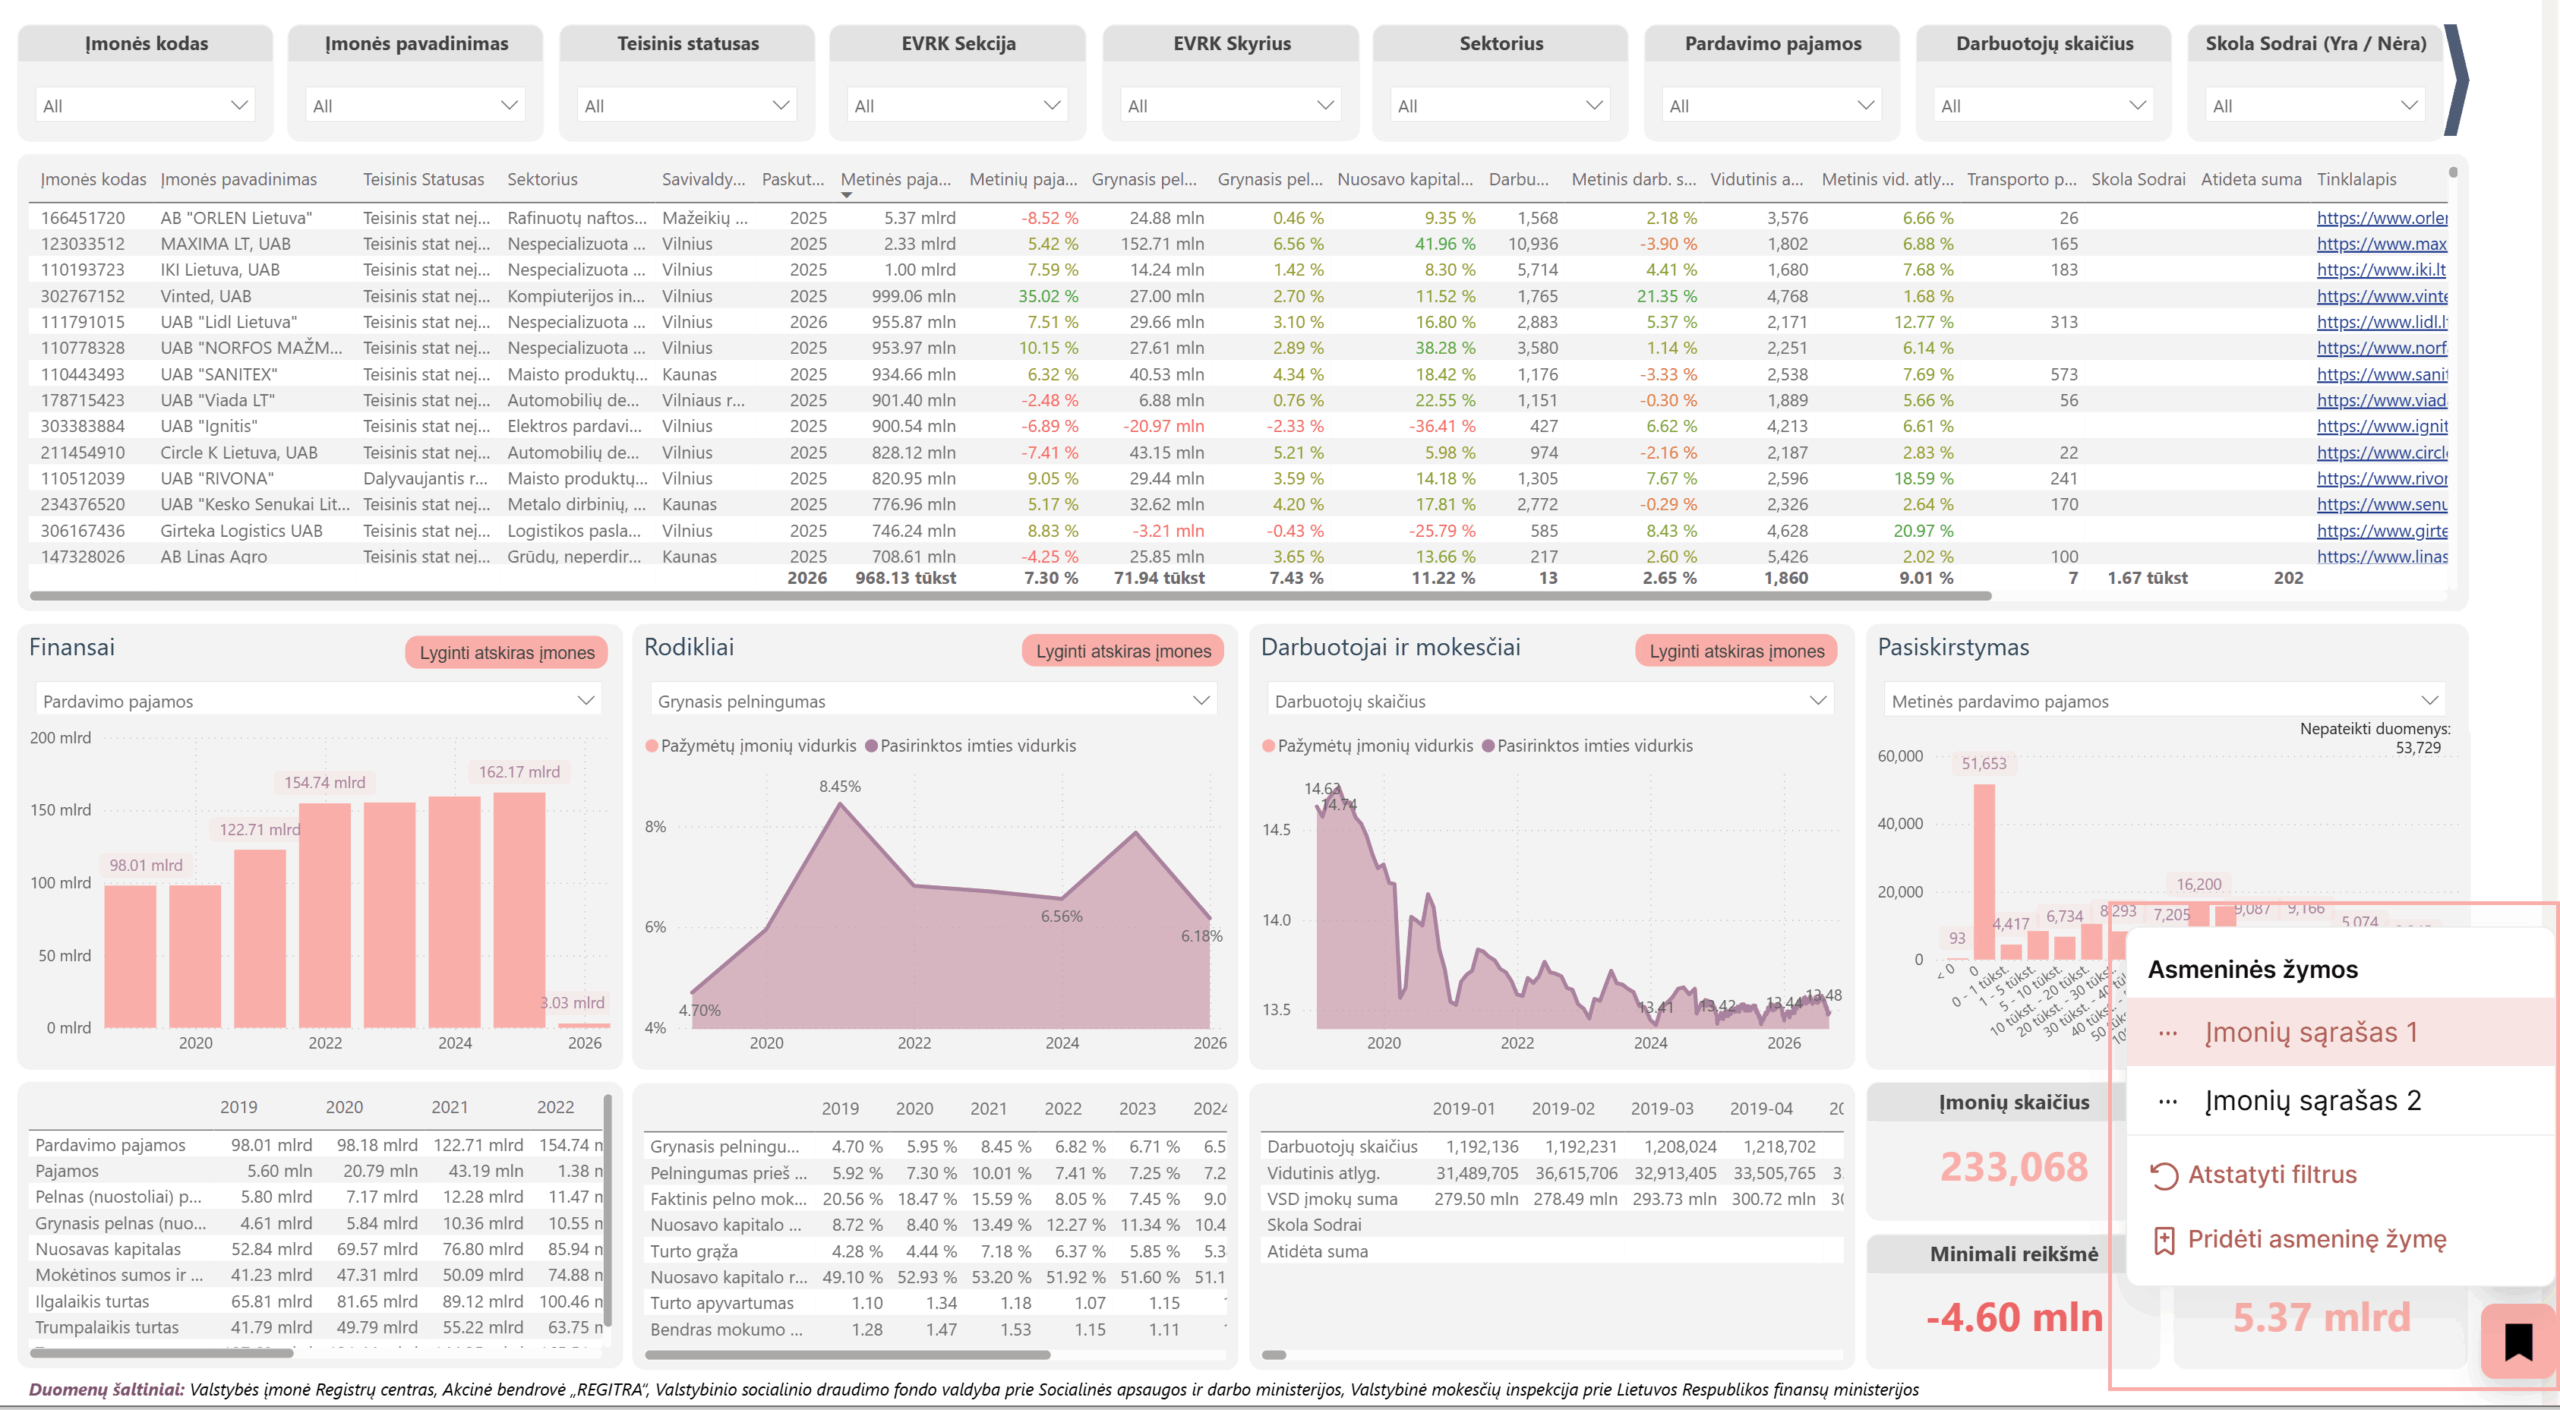
By regularly analyzing the market, your company’s position, and competitors’ performance, it becomes easier to identify important changes, understand their direction, and make data-driven business decisions.


